

第 5 章 plot() 主流程全景
第 3 章给出了模块地图,第 4 章拆开了六个核心抽象。但地图与零件都还不等于"机器怎么转"。本章回到唯一的编排器
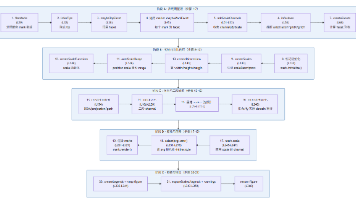
src/plot.js,把plot(options)这 340 行代码拆成 21 个可验证的步骤、5 个语义阶段。这一章是整本教程的"总枢纽":第 6 章的 scale 推断、第 7 章的 transform、第 8 章的 render、第 9 章的 facet/axis/legend,全都发生在下面的 21 步里。把本章的步骤编号记住,后面每一章你都能准确定位到"它插在哪一步"。
读完本章应该能回答:
- 从
Plot.plot({...})到返回一个<svg>,一共经过哪些阶段?每个阶段的输入输出是什么?- 为什么
createScales要被调用两次(第 9 步与第 15 步)?facetStateByMark/channelsByScale/stateByMark这三张 Map 分别在什么时机被写入、被谁读取?
5.1 为什么这段代码值得逐行读
在 Plot 的 81 个 .js 文件里,plot.js 是**最不像"库代码"**的一个:745 行里绝大多数是顺序执行的语句,而不是可复用的函数或类。很多人第一次看会疑惑——为什么不把这段逻辑拆成十几个小模块?
答案是:plot() 的核心价值就是"顺序"本身。
图形库最容易出问题的地方不是某个算法写错,而是步骤顺序颠倒。举几个真实存在的顺序约束:
- 必须先收集完所有 channel 才能创建比例尺(否则 domain 不完整);
- 必须先算出比例尺的 domain 才能创建 facets(因为 facet 的格子数由 fx/fy 的 domain 决定);
- 又必须在 facets 建好之后重排它们,因为 fx/fy 的 domain 此时才最终确定(第 16 步);
- 必须先
createContext才能让某些 mark 的 initializer 生成二级 channel(如坐标轴的刻度); - 而 initializer 生成的新 channel 可能需要新的比例尺,于是要回头重建 scales(第 15 步)。
这些约束用"拆成模块 + 事件回调"表达会立刻变得难以追踪。把流程写在一个函数里,用注释标注顺序依赖,反而是这个场景下最清晰的选择。读它的正确姿势是:不要试图记住每一行的细节,而是记住"阶段边界"和"为什么这两个阶段的先后不能换"。
5.2 21 步全景图(基于 src/plot.js L22-L361 真实代码)
先看全貌。下图每一步都标注了对应的源码行号,便于对照阅读:
21 步可以归成 5 个语义阶段,每个阶段有一个明确的"产物":
| 阶段 | 步骤 | 产物 | 一句话职责 |
|---|---|---|---|
| A. 声明期整理 | 1–7 | marks / facetStateByMark / channelsByScale | 把用户写的 declarations 整理成"可执行的结构" |
| B. 初始化与比例尺 | 8–12 | stateByMark / scaleDescriptors / scales / dimensions | 数据物化 + 度量系统建立 |
| C. 环境与二阶通道 | 13–16 | context / 新增 channels / 最终 facets | 准备运行时环境并按需重算 |
| D. 缩放与渲染 | 17–19 | 各 mark 的 SVG 节点 | 数值 → 像素 → DOM |
| E. 包装与输出 | 20–21 | figure(含图例、.scale、.legend) | 组装最终返回值 |
下面逐阶段展开。
5.3 阶段 A:声明期整理(步骤 1–7)
步骤 1–2:扁平化 marks 与隐式 tip。 Plot 允许 marks 里写数组、写 null(用于条件渲染),也允许 mark 自己声明 tip: true:
// src/plot.js L28-L32
// Flatten any nested marks.
const marks = options.marks === undefined ? [] : flatMarks(options.marks);

// Add implicit tips.
marks.push(...inferTips(marks));
flatMarks 用 flat(Infinity) 把嵌套数组压平,并顺手做了一次类型归一化:任何带 render 方法的普通对象会被 markify 包成 Render 实例(Render extends Mark)。这就是 “render 函数可以直接当 mark 用” 的实现方式。
inferTips 则展示了 Plot 的一个取向:尽量把用户没写的、但显然需要的东西补上。如果某个 mark 声明了 tip,它会自动派生出若干 tip mark,且继承原 mark 的 facet 设置——第 2 步就完成的隐式补全,是后面 marks 数组里"多出来的那些 mark"的来源。
步骤 3–4:两层 facet 状态。 facet 有两种写法:顶层 facet: {x: "year"}(作用于所有 mark),以及 mark 级 Plot.dot(data, {fx: "year"})。plot.js 把两者统一成同一套结构:
// src/plot.js L38-L48
// Compute the top-level facet state. This has roughly the same structure as
// mark-specific facet state, except there isn’t a facetsIndex, and there’s a
// data and dataLength so we can warn the user if a different data of the same
// length is used in a mark.
// 译:计算顶层分面状态。结构与 mark 级分面状态大体相同,区别在于没有 facetsIndex,
// 但多了 data 和 dataLength——以便在某个 mark 用了“同长度的另一份数据”时向用户告警。
const topFacetState = maybeTopFacet(facet, options);
// Construct a map from (faceted) Mark instance to facet state, including:
// channels - an {fx?, fy?} object to add to the fx and fy scale
// groups - a possibly-nested map from facet values to indexes in the data array
// facetsIndex - a sparse nested array of indices corresponding to the valid facets
// 译:构造一个从(分面的)Mark 实例到分面状态的映射,包括:
// channels - 一个会被并入 fx/fy 比例尺的 {fx?, fy?} 对象
// groups - 一个可能嵌套的 Map:从分面值映射到数据数组中的索引
// facetsIndex - 一个与有效 facets 对应的稀疏嵌套索引数组
const facetStateByMark = new Map();
for (const mark of marks) {
  const facetState = maybeMarkFacet(mark, topFacetState, options);
  if (facetState) facetStateByMark.set(mark, facetState);
}
这里有个容易忽略的细节:maybeMarkFacet 在 L505-L513 埋了一个警告——当 mark 的数据与 facet 数据长度相同但不是同一个引用时,说明用户很可能忘了写 facet: true,Plot 会把这条提醒累积到 warning 里(最后统一显示,见第 21 步)。
步骤 5–7:收集通道、插入隐式坐标轴、生成 facets。
// src/plot.js L50-L53
// Compute a Map from scale name to an array of associated channels.(计算一个从 scale 名到相关通道数组的 Map)
const channelsByScale = new Map();
if (topFacetState) addScaleChannels(channelsByScale, [topFacetState], options);
addScaleChannels(channelsByScale, facetStateByMark, options);
注意第 5 步的入参是 stateByMark 这个名字,但实际传的是 facetStateByMark——因为此时 mark 还没 initialize,还没有 channel 可收集。这个参数在 L143 会再被调用一次,那时才是真正的"从 mark 状态收集 channel"。同一个函数被调用两次、喂进两种数据源,是这份代码里最容易看错的地方之一。
// src/plot.js L58-L63
// Add implicit axis marks. Because this happens after faceting (because it
// depends on whether faceting is present), we must initialize the facet state
// of any implicit axes, too.
// 译:添加隐式坐标轴 mark。由于这一步发生在分面处理之后(它取决于是否存在分面),
// 隐式轴也必须补上各自的分面状态。
const axes = flatMarks(inferAxes(marks, channelsByScale, options));
for (const mark of axes) {
  const facetState = maybeMarkFacet(mark, topFacetState, options);
  if (facetState) facetStateByMark.set(mark, facetState);
}
marks.unshift(...axes);   // 隐式轴放到用户 marks 之前
第 6 步是"零配置出图"的关键一环:inferAxes 会根据 channelsByScale 里有没有 x/y,决定要不要插入 axisX/axisY/gridX/gridY(第 9 章详解)。生成的轴 mark 也要补一遍 facet 状态,因为它们同样是 mark。
marks.unshift(...axes) 用 unshift 而不是 push 是有意的:坐标轴要画在图形之下,而 SVG 的绘制顺序等于 DOM 顺序,所以必须先渲染。这一个方法名的选择,决定了"网格线不会遮住数据点"。
5.4 阶段 B:初始化与比例尺(步骤 8–12)
步骤 8:数据物化。 这是"声明"变成"数据"的一步:
// src/plot.js L133-L140
// Initialize the marks’ state.(初始化各个 mark 的状态)
for (const mark of marks) {
  if (stateByMark.has(mark)) throw new Error("duplicate mark; each mark must be unique");
  const {facetsIndex, channels: facetChannels} = facetStateByMark.get(mark) ?? {};
  const {data, facets, channels} = mark.initialize(facetsIndex, facetChannels, options);
  applyScaleTransforms(channels, options);
  stateByMark.set(mark, {data, facets, channels});
}
三件事值得记住:
- 同一个 mark 实例不能出现在
marks里两次,否则直接抛错(duplicate mark; each mark must be unique)。这解释了一个常见困惑:为什么把一个 mark 变量同时用于两个图会出问题——不是"复制",而是"复用了同一个状态槽"。 mark.initialize内部会先跑 transform、再建 channels(第 7 章),所以这里拿到的data已经被过滤/分桶/堆叠过了。applyScaleTransforms会把x: {percent: true}这类"比例尺级的数值变换"应用到 channel 值上,并把channel.transform置为 false,避免第 17 步重复应用。
步骤 9–12:比例尺与尺寸。
// src/plot.js L143-L151
// Initialize the scales and dimensions.(初始化比例尺与尺寸)
const scaleDescriptors = createScales(addScaleChannels(channelsByScale, stateByMark, options), options);
const dimensions = createDimensions(scaleDescriptors, marks, options);

autoScaleRange(scaleDescriptors, dimensions);

const scales = createScaleFunctions(scaleDescriptors);
const {fx, fy} = scales;
const subdimensions = fx || fy ? innerDimensions(scaleDescriptors, dimensions) : dimensions;
const superdimensions = fx || fy ? actualDimensions(scales, dimensions) : dimensions;
这四步的顺序不可交换,原因环环相扣:
createScales需要完整的channelsByScale(所以必须在第 8 步之后)→ 产出ScaleDescriptor(含 domain,但不含 range);createDimensions需要 scale 来判断 y 轴类别数(决定默认高度是 20px × n 还是 60px + 20px × n)→ 产出画布尺寸与边距;autoScaleRange需要 dimensions 才能算出 position scale 的 range([marginLeft, width - marginRight])——这就是"range"与"尺寸"之间的循环依赖,只能靠"先尺寸后 range"打破;createScaleFunctions才把 descriptor 实例化成可调用的函数。
第 11 步的注释 // position scale 自动 range 就是这条因果链的坐标。第 6 章会把第 9–12 步完整重演一遍。
另外注意 subdimensions / superdimensions 的区分:分面时,每个 facet 内部用的是 subdimensions(窄/矮),而 frame 这类"跨越所有 facet"的 mark 用 superdimensions(整体尺寸)。一个 mark 用哪一套,取决于它的 facet 是否为 "super"(第 13 章有实例)。
5.5 阶段 C:环境与二阶通道(步骤 13–16)
步骤 13:创建渲染上下文。
// src/plot.js L154-L170(节选)
// Initialize the context.(初始化上下文)
const context = createContext(options);
const document = context.document;
const svg = creator("svg").call(document.documentElement);
let figure = svg; // replaced with the figure element, if any(之后若生成 figure 元素,此引用会被替换)
context.ownerSVGElement = svg;
context.className = className;
context.projection = createProjection(options, subdimensions);

// A path generator for marks that want to draw GeoJSON.(一个供需要绘制 GeoJSON 的 mark 使用的路径生成器)
context.path = function () {
  return geoPath(this.projection ?? xyProjection(scales));
};
💡 PS:被节选省略的后三个能力,源码里各配了一句注释——
filterFacets:“Allows e.g. the axis mark to determine faceting lazily.”(让坐标轴这类 mark 能惰性确定分面);getMarkState:“Allows e.g. the tip mark to reference channels and data on other marks.”(让 tip mark 能引用其他 mark 的通道与数据);dispatchValue:“Allows e.g. the pointer transform to support viewof.”(让 pointer 交互变换支持 Observable 的 viewof)。
context 本身只是 {document, clip}(context.js 全文只有 11 行),但 plot.js 在这里给它挂上了 6 个能力:ownerSVGElement、className、projection、path、filterFacets、getMarkState、dispatchValue。这就是第 4 章说的"依赖注入式环境"——核心代码只依赖 context 这个接口,不直接碰 window 或 document,因此可以在 Node/jsdom 里跑测试。
context.path 用 this 而不是闭包变量,是为了让每个 mark 拿到属于自己的路径生成器(this.projection 可以被 mark 覆盖)。
步骤 14:initializer(二阶通道)。 有些 channel 无法在数据物化阶段算出来,必须等比例尺和上下文就绪。典型例子是坐标轴的刻度位置(要知道尺寸)、hexbin 的网格对齐。plot.js 为这类 mark 留了一个"第二次机会":
// src/plot.js L188-L213(节选)
// Reinitialize; for deriving channels dependent on other channels.(重新初始化;用于派生依赖其他通道的通道)
for (const [mark, state] of stateByMark) {
  if (mark.initializer != null) {
    const dimensions = mark.facet === "super" ? superdimensions : subdimensions;
    const update = mark.initializer(state.data, state.facets, state.channels, scales, dimensions, context);
    if (update.data !== undefined) state.data = update.data;
    if (update.facets !== undefined) state.facets = update.facets;
    if (update.channels !== undefined) {
      const {fx, fy, ...channels} = update.channels; // separate facet channels(把 facet 通道分离出来)
      inferChannelScales(channels);
      Object.assign(state.channels, channels);
      for (const channel of Object.values(channels)) {
        const {scale} = channel;
        // Initializers aren’t allowed to redefine position scales as this
        // would introduce a circular dependency; so simply scale these
        // channels as-is rather than creating new scales, and assume that
        // they already have the scale’s transform applied, if any (e.g., when
        // generating ticks for the axis mark).
        // 译:不允许 initializer 重新定义位置比例尺,否则会引入循环依赖;因此这些通道
        // 按原样缩放、不创建新 scale,并假定它们已应用过 scale 的 transform(若有,
        // 例如为坐标轴 mark 生成刻度时)。
        if (scale != null && !isPosition(scaleRegistry.get(scale))) {
          applyScaleTransform(channel, options);
          newByScale.add(scale);
        }
      }
三个关键约束:
- initializer 只能新增非位置通道(
isPosition判断)。原因很直白:位置比例尺的 domain 已经用来算尺寸了,如果此刻还能改,就出现"尺寸 ↔ domain"的循环依赖。源码注释写得比任何文档都清楚。 - initializer 不能定义 transform(
basic.js里会抛transforms cannot be applied after initializers)。因为数据此刻已经被物化,再改数据会让已算好的比例尺失效。 - 新增的非位置通道如果带 scale,会被记进
newByScale,并在第 15 步触发一次"按需重建"。
步骤 15:按需重建 scales。
// src/plot.js L224-L233
// Reconstruct scales if new scaled channels were created during
// reinitialization. Preserve existing scale labels, if any.
// 译:若重新初始化期间产生了新的带 scale 通道,则重建比例尺;并保留已有的 scale 标签(若有)。
if (newByScale.size) {
  const newChannelsByScale = new Map();
  addScaleChannels(newChannelsByScale, stateByMark, options, (key) => newByScale.has(key));
  addScaleChannels(channelsByScale, stateByMark, options, (key) => newByScale.has(key));
  const newScaleDescriptors = inheritScaleLabels(createScales(newChannelsByScale, options), scaleDescriptors);
  const {scales: newExposedScales, ...newScales} = createScaleFunctions(newScaleDescriptors);
  Object.assign(scaleDescriptors, newScaleDescriptors);
  Object.assign(scales, newScales);
  Object.assign(scales.scales, newExposedScales);
}
这是全流程唯一一处"回头重做"。它做了三件很讲究的事:只重建受影响的 scale(用 filter 函数 newByScale.has 过滤)、保留原有 label(inheritScaleLabels,否则第 9 步推断出来的轴标题会丢)、用 Object.assign 原地更新对象(因为 scales 的引用已经被闭包捕获,换新对象会导致 Figure 上暴露的 .scale() 与实际渲染用的不是同一个)。
步骤 16:按最终 domain 重排 facets。
// src/plot.js L238-L242
// Sort and filter the facets to match the fx and fy domains; this is needed
// because the facets were constructed prior to the fx and fy scales.
// 译:排序并过滤 facets 使其与 fx/fy 的 domain 一致;之所以需要这一步,是因为 facets
// 是在 fx/fy 比例尺之前构建的。
if (facets !== undefined) {
  facetDomains = {x: fx?.domain(), y: fy?.domain()};
  facets = recreateFacets(facets, facetDomains);
  facetTranslate = facetTranslator(fx, fy, dimensions);
}
第 7 步创建 facets 时,fx/fy 的 domain 还只是"初步推断";经过第 9–11 步的 scale 计算(可能被用户显式 domain 覆盖、可能被 nice 圆整),真实 domain 才确定。recreateFacets 会删掉 domain 里已不存在的格子并按新顺序重排——这正是"空白分面不再显示"的实现位置。
5.6 阶段 D:缩放与渲染(步骤 17–19)
步骤 17:应用比例尺。
// src/plot.js L244-L247
// Compute value objects, applying scales and projection as needed.(计算 value 对象,按需应用比例尺与投影)
for (const [mark, state] of stateByMark) {
  state.values = mark.scale(state.channels, scales, context);
}
一行调用背后是第 4 章讲过的 valueObject:把 channels.x.value = [12, 15, 23] 变成 values.x = [64.3, 128.6, ...](像素值)。注意它在 render 之前统一做完全部 mark,而不是每个 mark 渲染时各自算——这保证了同类图形在画布上的一致性。
步骤 18:构建 svg 根元素。
// src/plot.js L251-L278(节选)
select(svg)
  .attr("class", className)
  .attr("fill", "currentColor")
  .attr("font-family", "system-ui, sans-serif")
  .attr("font-size", 10)
  .attr("text-anchor", "middle")
  .attr("width", width)
  .attr("height", height)
  .attr("viewBox", `0 0 ${width} ${height}`)
  .attr("aria-label", ariaLabel)
  .attr("aria-description", ariaDescription)
  .call((svg) =>
    // Warning: if you edit this, change defaultClassName.(警告:若修改这里,请同步修改 defaultClassName。)
    svg.append("style").text(`:where(.${className}) { --plot-background: white; ... }`)
  )
  .call(applyInlineStyles, style);
💡 PS:那句 Warning 指向
style.js里的defaultClassName常量——注入的内联<style>用:where(.${className})选择器匹配类名,两处必须同步;若只改一处,默认样式会静默失效。
这里透露了 Plot 的样式策略:根元素上挂一部分默认值(字体、文字锚点、currentColor),再注入一段 CSS 变量,其余属性交给每个 mark。fill: currentColor 尤其关键——它让所有图形默认继承文字颜色,从而"跟随主题色",也就有了 stroke: "currentColor" 这种写法(回头看 dot.js 的 defaults)。
步骤 19:渲染每个 mark。 分支逻辑只有两段,但覆盖了 facet 的全部情形:
// src/plot.js L281-L294(非分面分支)
// Render marks.(渲染各个 mark)
for (const mark of marks) {
  const {channels, values, facets: indexes} = stateByMark.get(mark);
  // Render a non-faceted mark.(渲染非分面的 mark)
  if (facets === undefined || mark.facet === "super") {
    let index = null;
    if (indexes) {
      index = indexes[0];
      index = mark.filter(index, channels, values);   // 过滤 undefined 等无效值
      if (index.length === 0) continue;
    }
    const node = mark.render(index, scales, values, superdimensions, context);
    if (node == null) continue;
    svg.appendChild(node);
  }
  // ...分面分支见 L297-L327(源码注释:// Render a faceted mark. 渲染分面的 mark)
}
三个细节:① mark.filter 是每个 facet 单独调用的,它默认过滤掉值为 undefined 的记录(defined),这就是"数据里的 NaN 不会画出点"的原因;② node == null 时跳过,允许 mark 用 render 返回 null 表示"本次不画";③ 分面分支里有一段 subarray(index) 的拷贝和 index.fx / index.fy / index.fi 的赋值——索引数组被当成"带标注的数组"使用,把 facet 信息直接挂在数组对象上,避免再传一个参数。
5.7 阶段 E:包装与输出(步骤 20–21)
步骤 20:图例与 figure 包装。
// src/plot.js L330-L341(节选)
// Wrap the plot in a figure, if needed.(如有需要,把整张图包进 figure 元素)
const legends = createLegends(scaleDescriptors, context, options);
const {figure: figured = title != null || subtitle != null || caption != null || legends.length > 0} = options;
if (figured) {
  figure = document.createElement("figure");
  figure.className = `${className}-figure`;
  figure.style.maxWidth = "initial"; // avoid Observable default style(避开 Observable notebook 的默认 figure 样式)
  if (title != null) figure.append(createTitleElement(document, title, "h2"));
  if (subtitle != null) figure.append(createTitleElement(document, subtitle, "h3"));
  figure.append(...legends, svg);
  if (caption != null) figure.append(createFigcaption(document, caption));
  if ("value" in svg) (figure.value = svg.value), delete svg.value;
}
注意 figured 的默认值是一个表达式:只要你写了 title/subtitle/caption 或产生了图例,就自动包 <figure>。这是一条典型的"隐式智能":用户不需要知道 <figure> 这个 HTML 元素,却能自动获得语义化的结构。而 if ("value" in svg) 那两行是为了支持 Observable 的 viewof 模式——把 value 属性从 svg 搬到外层 figure 上。
步骤 21:暴露 scale/legend 与控制台警告。
// src/plot.js L343-L358(节选)
figure.scale = exposeScales(scales.scales, context);
figure.legend = exposeLegends(scaleDescriptors, context, options);

const w = consumeWarnings();
if (w > 0) {
  select(svg).append("text").attr("x", width).attr("y", 20).attr("dy", "-1em")
    .attr("text-anchor", "end")
    .attr("font-family", "initial") // fix emoji rendering in Chrome(修复 Chrome 中的 emoji 渲染)
    .text("\u26a0\ufe0f") // emoji variation selector(emoji 变体选择符,确保渲染为彩色图标而非黑白字符)
    .append("title")
    .text(`${w.toLocaleString("en-US")} warning${w === 1 ? "" : "s"}. Please check the console.`);
}
警告系统值得单独说一句:Plot 内部的 warn() 会把消息累积到一个模块级队列里,最后只在图上画一个 ⚠️ 图标,真正的信息在 console。这是"不打断出图"的设计——很多库会在数据有问题时直接抛错或把警告糊在图上,Plot 选择了"可忽略但可追溯"。
5.8 完整流程时序图
上面的 21 步是"代码视角",下面这张时序图换成"参与者视角",展示各模块之间的调用往返。建议对照上图一起看:流程图回答"下一步是什么",时序图回答"这一步是谁调用谁"。
5.9 三张状态表
Plot 在 plot() 内部维护 3 张核心 Map。理解它们的"写入时机"与"消费者",就掌握了 90% 的状态流转:
// src/plot.js L43-L53(精简)
const facetStateByMark = new Map();     // ① 分面状态
// Compute a Map from scale name to an array of associated channels.(计算一个从 scale 名到相关通道数组的 Map)
const channelsByScale = new Map();      // ② 通道按 scale 归类
const stateByMark = new Map();          // ③ mark 运行时状态
| Map | Key | Value | 由谁写(时机) | 由谁读 |
|---|---|---|---|---|
facetStateByMark | Mark | {channels:{fx,fy}, groups: Map, facetsIndex?} | maybeMarkFacet(步骤 4/6);facetsIndex 在步骤 7 补写 | facetFilter、渲染分支 |
channelsByScale | scaleName: string | Channel[] | addScaleChannels(步骤 5 与步骤 9 各写一次) | createScales、inferAxes |
stateByMark | Mark | {data, facets, channels, values} | mark.initialize(步骤 8)写前三项;mark.scale(步骤 17)写 values | mark.render、initializer、getMarkState |
再补一张"生命周期"视图,把三张 Map 的写入点连起来:
为什么 channelsByScale 要写两次? 第一次(步骤 5)写入的是 facet 通道(fx/fy),目的是让 createFacets 能拿到 fx/fy 的 domain;第二次(步骤 9)写入的是所有 mark 的常规通道,目的是创建最终的比例尺。两次之间隔着 mark.initialize——因为通道要等数据物化后才存在。这条"两次写入"的因果链,是理解 plot.js 结构的关键。
5.10 常见误区
- 「
plot()里没有循环渲染,说明它很轻」——恰恰相反。21 步里有 3 个for (const mark of marks)循环(步骤 8、14、17、19 各一次),每次循环的职责不同:物化 → 二阶通道 → 缩放 → 渲染。把它们合并在一个循环里会破坏"所有 mark 的 scale 必须先于所有 mark 的 render"这一全局约束。 - 「
mark.render自己做缩放」——不是。渲染时values已经是像素值,mark 只负责把它们写进cx/cy/d等属性。很多人第一次自定义 mark 时在这里又调了一遍 scale,导致双重缩放。 - 「
createScales只被调用一次」——正常路径一次,但只要有 initializer 产生新 scale,就会有第二次(步骤 15)。这解释了一个现象:某些 mark(如 hexbin、axis)会让同名的 scale 被计算两遍,调试时不要误认为是 bug。 - 「facet 的格子是先算好的」——不是。facets 先建(步骤 7)再按最终 domain 重排(步骤 16)。如果你的分面出现顺序怪异的空白格,多半是 domain 被显式指定或
nice圆整影响,去看recreateFacets。
5.11 本章小结
plot()是全库唯一编排器,21 步、5 个阶段:整理声明 → 初始化与比例尺 → 环境与二阶通道 → 缩放与渲染 → 包装与输出。- 阶段顺序不能交换的根本原因有两条:domain 依赖数据(所以要等 initialize)、range 依赖尺寸(所以要等 dimensions);而副作用(initializer 新增 scale)必须靠"按需重算"补齐。
- 三张 Map 是状态流转的核心:
facetStateByMark(分面)、channelsByScale(两次写入)、stateByMark(两阶段写入、一处读取)。 - 隐式行为都在这个函数里发生:隐式 tip(步骤 2)、隐式坐标轴(步骤 6)、自动
<figure>包装(步骤 20)、警告图标(步骤 21)。"零配置"不是魔法,而是这四段代码。
下一章聚焦第 9–12 步里最"聪明"的一段:当用户完全不写 scale 时,Plot 如何决定用 linear 还是 band、domain 与 range 又从哪里来。
转载自 CSDN-专业IT技术社区
原文链接:https://blog.csdn.net/qq_16381291/article/details/165302214