
ArcGIS JS 基础教程(39):LayerList 图层列表组件
零、写在前面
📌 本系列教程完整目录:ArcGIS JS 系列基础教程(100个项目常用热门功能)
💡 在线示例:完整可运行的 HTML 示例,无需任何环境配置,可直接在浏览器中打开体验
🗂️ 专栏导航:收藏 + 关注,专栏文章第一时间送达
❤️ 一键三连:点赞 + 评论 + 收藏
一、功能介绍
LayerList(图层列表)是 ArcGIS Maps SDK for JavaScript 中用于集中管理地图图层的可视化组件。它以树状列表的形式展示 Map 中所有图层,并允许用户:
- 开关图层可见性(勾选/取消勾选)
- 调整图层透明度、图例联动
- 展开子图层(如 GroupLayer / 地图服务子图层)
- 为每个图层项追加自定义操作(如「缩放到」「属性表」「导出」)
在 5.0 版本中,LayerList 既可用命令式 LayerList widget(new LayerList({ view })),也可用声明式的 <arcgis-layer-list> Web Component。本课一律使用组件(component)实现,符合「组件优先」原则,代码更简洁、与 HTML 结构解耦。
参考:官方 arcgis-layer-list 组件参考 | LayerList widget 示例
💡 三维要点:在
SceneView中,图层列表的行为与 2D 完全一致,但每个图层项可联动其 3D 符号(如point-3d/object符号)。本课所有图层均为三维符号(elevationInfo+object几何),列表操作会实时反映到 3D 场景。
二、功能实现
2.1 声明组件并绑定视图
<arcgis-layer-list> 放在普通 div 面板中即可独立使用;独立使用时必须手动把 view 赋值给组件:
<!DOCTYPE html>
<html lang="zh-CN">
<head>
    <meta charset="UTF-8">
    <meta name="viewport" content="width=device-width, initial-scale=1.0">
    <title>第39课:LayerList 图层列表组件</title>
    <link rel="stylesheet" href="https://js.arcgis.com/5.0/esri/themes/light/main.css">
    <script type="module" src="https://js.arcgis.com/5.0/"></script>
    <style>
        * { margin: 0; padding: 0; box-sizing: border-box; }
        body { font-family: "Microsoft YaHei", sans-serif; }
        #mapContainer { width: 100vw; height: 100vh; }
        .page-title {
            position: absolute; top: 20px; left: 50%; transform: translateX(-50%);
            background: rgba(255,255,255,0.95); padding: 10px 24px; border-radius: 6px;
            font-size: 18px; font-weight: bold; z-index: 100;
            box-shadow: 0 2px 8px rgba(0,0,0,0.15);
        }
        /* 左侧:arcgis-layer-list 组件面板 */
        .layer-panel {
            position: absolute; top: 80px; left: 20px;
            width: 280px; max-height: 70vh; overflow: auto;
            background: rgba(255,255,255,0.97); padding: 12px; border-radius: 8px;
            box-shadow: 0 2px 12px rgba(0,0,0,0.15);
            z-index: 100;
        }
        .layer-panel h3 { margin: 0 0 8px 0; font-size: 14px; color: #333; }
        #layerList { width: 100%; --calcite-ui-foreground-1: #fff; }

        /* 右侧:控制面板 */
        .control-panel {
            position: absolute; top: 80px; right: 20px;
            background: rgba(255,255,255,0.95); padding: 16px; border-radius: 8px;
            box-shadow: 0 2px 12px rgba(0,0,0,0.15);
            z-index: 100; min-width: 240px;
        }
        .control-panel h3 { margin: 0 0 8px 0; font-size: 14px; color: #333; }
        .btn-row { display: flex; gap: 8px; flex-wrap: wrap; margin-top: 6px; }
        .btn-row button {
            flex: 1; min-width: 100px; padding: 6px 0;
            border: 1px solid #d9d9d9; border-radius: 4px;
            background: white; cursor: pointer; font-size: 12px;
        }
        .btn-row button:hover { border-color: #1890ff; color: #1890ff; }
        .btn-row button.on { background: #1890ff; color: white; border-color: #1890ff; }
        .info-card {
            margin-top: 10px; padding: 10px 12px;
            background: #f0f5ff; border-radius: 6px;
            border-left: 3px solid #1890ff; font-size: 12px; line-height: 1.8;
        }
        .info-card .val { font-weight: bold; color: #1890ff; }
        .status-text {
            position: absolute; bottom: 20px; left: 50%; transform: translateX(-50%);
            background: rgba(0,0,0,0.7); color: white; padding: 8px 20px;
            border-radius: 20px; font-size: 13px; z-index: 100; pointer-events: none;
            white-space: nowrap;
        }
    </style>
</head>
<body>
<h1 class="page-title">第39课:LayerList 图层列表组件</h1>

<div class="layer-panel">
    <h3>📋 图层列表(arcgis-layer-list 组件)</h3>
    <arcgis-layer-list id="layerList"></arcgis-layer-list>
</div>

<div class="control-panel">
    <h3>🎛️ 图层控制</h3>
    <div class="btn-row">
        <button id="btnAdd">➕ 添加监测区</button>
        <button id="btnRemove">➖ 移除监测区</button>
    </div>
    <div class="btn-row">
        <button id="btnSelect" class="on">☑️ 选中模式</button>
        <button id="btnStatus" class="on">💡 状态指示器</button>
    </div>
    <div class="info-card">
        <div>当前图层数:<span class="val" id="layerCount">0</span></div>
        <div>选中图层:<span class="val" id="selInfo">无</span></div>
    </div>
</div>

<div class="status-text" id="statusText">LayerList | 使用 arcgis-layer-list 组件管理图层</div>

<div id="mapContainer"></div>

<script type="module">
    const [Map, SceneView, FeatureLayer, GraphicsLayer, Graphic] = await $arcgis.import([
        "@arcgis/core/Map.js",
        "@arcgis/core/views/SceneView.js",
        "@arcgis/core/layers/FeatureLayer.js",
        "@arcgis/core/layers/GraphicsLayer.js",
        "@arcgis/core/Graphic.js"
    ]);
    const getTianditu = await $arcgis.import("https://openlayers.vip/examples/resources/tianditu.js");

    const vecLayers = getTianditu.default({ type: "vec_w" });
    const map = new Map({ basemap: { baseLayers: [vecLayers.base, vecLayers.anno] } });

    const view = new SceneView({
        container: "mapContainer", map: map,
        camera: {
            position: { longitude: 121.498, latitude: 31.205, z: 4000 },
            heading: 20, tilt: 60
        }
    });

    // ===== 图层 1:客户端要素图层(监测点,按类别唯一值着色) =====
    function buildMonitorLayer() {
        const cats = ["A类", "B类", "C类"];
        const colors = {
            "A类": [227, 74, 51],
            "B类": [56, 135, 220],
            "C类": [60, 180, 110]
        };
        const graphics = [];
        for (let i = 0; i < 90; i++) {
            const cat = cats[i % 3];
            graphics.push(new Graphic({
                geometry: {
                    type: "point",
                    x: 121.46 + Math.random() * 0.08,
                    y: 31.18 + Math.random() * 0.06,
                    z: 80 + Math.random() * 400,
                    spatialReference: { wkid: 4326 }
                },
                attributes: {
                    OBJECTID: i + 1,
                    NAME: "监测点" + (i + 1),
                    CATEGORY: cat
                }
            }));
        }
        return new FeatureLayer({
            source: graphics,
            objectIdField: "OBJECTID",
            fields: [
                { name: "OBJECTID", type: "oid" },
                { name: "NAME", type: "string" },
                { name: "CATEGORY", type: "string" }
            ],
            geometryType: "point",
            spatialReference: { wkid: 4326 },
            title: "实时监测点",
            elevationInfo: { mode: "relative-to-ground" },
            renderer: {
                type: "unique-value",
                field: "CATEGORY",
                uniqueValueInfos: cats.map(cat => ({
                    value: cat,
                    symbol: {
                        type: "point-3d",
                        symbolLayers: [{
                            type: "object",
                            resource: { primitive: "sphere" },
                            width: 220, height: 220, depth: 220,
                            material: { color: colors[cat] }
                        }]
                    }
                }))
            },
            popupTemplate: {
                title: "{NAME}",
                content: "类别:{CATEGORY}"
            }
        });
    }

    // ===== 图层 2:GraphicsLayer(三维建筑体) =====
    function buildBuildingLayer() {
        const layer = new GraphicsLayer({ title: "重点建筑体" });
        const bases = [
            { x: 121.490, y: 31.230, h: 900, c: [120, 170, 230] },
            { x: 121.495, y: 31.225, h: 1400, c: [230, 160, 70] },
            { x: 121.500, y: 31.220, h: 700, c: [120, 200, 160] },
            { x: 121.485, y: 31.218, h: 1100, c: [200, 120, 200] }
        ];
        bases.forEach((b, idx) => {
            layer.add(new Graphic({
                geometry: {
                    type: "point",
                    x: b.x, y: b.y, z: 0,
                    spatialReference: { wkid: 4326 }
                },
                symbol: {
                    type: "point-3d",
                    symbolLayers: [{
                        type: "object",
                        resource: { primitive: "cube" },
                        width: 350, depth: 350, height: b.h,
                        material: { color: b.c }
                    }]
                },
                attributes: { NAME: "建筑" + (idx + 1) }
            }));
        });
        return layer;
    }

    const monitorLayer = buildMonitorLayer();
    const buildingLayer = buildBuildingLayer();
    map.addMany([buildingLayer, monitorLayer]);

    // ===== 动态图层:按钮添加 / 移除的「监测区域」图层 =====
    let zoneLayer = null;
    function buildZoneLayer() {
        const graphics = [];
        for (let i = 0; i < 12; i++) {
            graphics.push(new Graphic({
                geometry: {
                    type: "point",
                    x: 121.47 + Math.random() * 0.05,
                    y: 31.19 + Math.random() * 0.04,
                    z: 200,
                    spatialReference: { wkid: 4326 }
                },
                attributes: { OBJECTID: i + 1, NAME: "区域点" + (i + 1) }
            }));
        }
        return new FeatureLayer({
            source: graphics,
            objectIdField: "OBJECTID",
            fields: [
                { name: "OBJECTID", type: "oid" },
                { name: "NAME", type: "string" }
            ],
            geometryType: "point",
            spatialReference: { wkid: 4326 },
            title: "临时监测区域",
            elevationInfo: { mode: "relative-to-ground" },
            renderer: {
                type: "simple",
                symbol: {
                    type: "point-3d",
                    symbolLayers: [{
                        type: "object",
                        resource: { primitive: "diamond" },
                        width: 260, height: 260, depth: 260,
                        material: { color: [255, 200, 0] }
                    }]
                }
            }
        });
    }

    // ===== LayerList 组件(arcgis-layer-list,组件优先,禁止改用 widget) =====
    const layerList = document.getElementById("layerList");
    layerList.view = view;                 // 独立组件需手动绑定 view
    layerList.selectionMode = "multiple";  // 5.0 用 selectionMode 控制选中能力(默认 "none")
    layerList.listItemCreatedFunction = (event) => {
        const item = event.item;
        // 为每个图层项追加「缩放到」操作按钮
        item.actionsSections = [[
            { type: "button", title: "缩放到图层", id: "zoom-to", icon: "magnifying-glass" }
        ]];
    };
    layerList.addEventListener("arcgisTriggerAction", (event) => {
        const { action, item } = event.detail;
        if (action.id === "zoom-to" && item.layer.fullExtent) {
            view.goTo(item.layer.fullExtent).catch(() => {});
            setStatus("已缩放到:" + item.title);
        }
    });
    layerList.addEventListener("arcgisPropertyChange", (event) => {
        if (event.detail.name === "selection") {
            const sel = layerList.selectedItems || [];
            document.getElementById("selInfo").textContent =
                sel.length ? sel.map(i => i.title).join("、") : "无";
        }
    });

    // ===== 图层数量随 map 变化自动刷新 =====
    function updateLayerCount() {
        document.getElementById("layerCount").textContent = view.map.layers.length;
    }
    view.map.layers.on("change", updateLayerCount);

    await view.when();
    updateLayerCount();
    // 默认定位:自动框选数据范围,确保初始视角合适
    await monitorLayer.when();
    view.goTo(monitorLayer.fullExtent, { duration: 1500 }).catch(() => {});
    setStatus("LayerList 组件就绪 | 共 " + view.map.layers.length + " 个图层");

    function setStatus(msg) { document.getElementById("statusText").textContent = msg; }

    // 添加 / 移除 监测区域图层(演示 LayerList 自动增删)
    document.getElementById("btnAdd").addEventListener("click", () => {
        if (zoneLayer) { setStatus("监测区域图层已存在"); return; }
        zoneLayer = buildZoneLayer();
        map.add(zoneLayer);
        setStatus("已添加临时监测区域图层");
    });
    document.getElementById("btnRemove").addEventListener("click", () => {
        if (!zoneLayer) { setStatus("没有可移除的监测区域图层"); return; }
        map.remove(zoneLayer);
        zoneLayer = null;
        setStatus("已移除临时监测区域图层");
    });

    // 选中模式开关
    let selectOn = true;
    document.getElementById("btnSelect").addEventListener("click", function () {
        selectOn = !selectOn;
        layerList.selectionMode = selectOn ? "multiple" : "none";
        this.classList.toggle("on", selectOn);
        setStatus(selectOn ? "已开启选中模式" : "已关闭选中模式");
    });

    // 状态指示器开关
    let statusOn = true;
    document.getElementById("btnStatus").addEventListener("click", function () {
        statusOn = !statusOn;
        layerList.visibleElements = { statusIndicators: statusOn };
        this.classList.toggle("on", statusOn);
        setStatus(statusOn ? "已显示状态指示器" : "已隐藏状态指示器");
    });
</script>
</body>
</html>
const layerList = document.getElementById("layerList");
layerList.view = view;             // 独立组件需手动绑定 view
layerList.selectionMode = "multiple"; // 5.0:selectionMode 取代了 selectionEnabled(默认 "none")
若
<arcgis-layer-list>作为<arcgis-scene>的子元素(带slot),则会自动继承视图,无需手动赋值。本课演示更通用的「独立面板」写法。
2.2 自定义列表项(listItemCreatedFunction)
通过 listItemCreatedFunction 为每个图层项追加操作按钮(如「缩放到图层」):
layerList.listItemCreatedFunction = (event) => {
    const item = event.item;
    item.actionsSections = [[
        { type: "button", title: "缩放到图层", id: "zoom-to", icon: "magnifying-glass" }
    ]];
};
2.3 响应操作事件(arcgisTriggerAction)
点击列表项上的自定义按钮会触发 arcgisTriggerAction 事件,通过 event.detail 拿到 action 与 item:
layerList.addEventListener("arcgisTriggerAction", (event) => {
    const { action, item } = event.detail;
    if (action.id === "zoom-to" && item.layer.fullExtent) {
        view.goTo(item.layer.fullExtent);
    }
});
2.4 选中与状态指示器
layerList.selectionMode = "multiple";                    // 选中模式("none" | "single" | "multiple" | "single-persist")
layerList.visibleElements = { statusIndicators: true };  // 状态指示器(加载/可见性)
三、功能应用
| 应用场景 | 说明 |
|---|---|
| 数据看板图层开关 | 用户自由显隐不同业务图层 |
| 三维场景图层管理 | 管理建筑体、监测点、区域等多类 3D 图层 |
| 自定义图层操作 | 通过 actionsSections 追加「属性表」「导出」「缩放到」 |
| 图层透明度调节 | 叠加显示时调整半透明图层的清晰度 |
| 子图层展开 | GroupLayer / 地图服务子图层的分级控制 |
四、核心代码
📦 完整代码 已保存至
sample/lesson39_layer_list.html,可直接在浏览器打开。
<!DOCTYPE html>
<html lang="zh-CN">
<head>
    <meta charset="UTF-8">
    <meta name="viewport" content="width=device-width, initial-scale=1.0">
    <title>第39课:LayerList 图层列表组件</title>
    <link rel="stylesheet" href="https://js.arcgis.com/5.0/esri/themes/light/main.css">
    <script type="module" src="https://js.arcgis.com/5.0/"></script>
    <style>
        * { margin: 0; padding: 0; box-sizing: border-box; }
        body { font-family: "Microsoft YaHei", sans-serif; }
        #mapContainer { width: 100vw; height: 100vh; }
        .page-title {
            position: absolute; top: 20px; left: 50%; transform: translateX(-50%);
            background: rgba(255,255,255,0.95); padding: 10px 24px; border-radius: 6px;
            font-size: 18px; font-weight: bold; z-index: 100;
            box-shadow: 0 2px 8px rgba(0,0,0,0.15);
        }
        /* 左侧:arcgis-layer-list 组件面板 */
        .layer-panel {
            position: absolute; top: 80px; left: 20px;
            width: 280px; max-height: 70vh; overflow: auto;
            background: rgba(255,255,255,0.97); padding: 12px; border-radius: 8px;
            box-shadow: 0 2px 12px rgba(0,0,0,0.15);
            z-index: 100;
        }
        .layer-panel h3 { margin: 0 0 8px 0; font-size: 14px; color: #333; }
        #layerList { width: 100%; --calcite-ui-foreground-1: #fff; }

        /* 右侧:控制面板 */
        .control-panel {
            position: absolute; top: 80px; right: 20px;
            background: rgba(255,255,255,0.95); padding: 16px; border-radius: 8px;
            box-shadow: 0 2px 12px rgba(0,0,0,0.15);
            z-index: 100; min-width: 240px;
        }
        .control-panel h3 { margin: 0 0 8px 0; font-size: 14px; color: #333; }
        .btn-row { display: flex; gap: 8px; flex-wrap: wrap; margin-top: 6px; }
        .btn-row button {
            flex: 1; min-width: 100px; padding: 6px 0;
            border: 1px solid #d9d9d9; border-radius: 4px;
            background: white; cursor: pointer; font-size: 12px;
        }
        .btn-row button:hover { border-color: #1890ff; color: #1890ff; }
        .btn-row button.on { background: #1890ff; color: white; border-color: #1890ff; }
        .info-card {
            margin-top: 10px; padding: 10px 12px;
            background: #f0f5ff; border-radius: 6px;
            border-left: 3px solid #1890ff; font-size: 12px; line-height: 1.8;
        }
        .info-card .val { font-weight: bold; color: #1890ff; }
        .status-text {
            position: absolute; bottom: 20px; left: 50%; transform: translateX(-50%);
            background: rgba(0,0,0,0.7); color: white; padding: 8px 20px;
            border-radius: 20px; font-size: 13px; z-index: 100; pointer-events: none;
            white-space: nowrap;
        }
    </style>
</head>
<body>
<h1 class="page-title">第39课:LayerList 图层列表组件</h1>

<div class="layer-panel">
    <h3>📋 图层列表(arcgis-layer-list 组件)</h3>
    <arcgis-layer-list id="layerList"></arcgis-layer-list>
</div>

<div class="control-panel">
    <h3>🎛️ 图层控制</h3>
    <div class="btn-row">
        <button id="btnAdd">➕ 添加监测区</button>
        <button id="btnRemove">➖ 移除监测区</button>
    </div>
    <div class="btn-row">
        <button id="btnSelect" class="on">☑️ 选中模式</button>
        <button id="btnStatus" class="on">💡 状态指示器</button>
    </div>
    <div class="info-card">
        <div>当前图层数:<span class="val" id="layerCount">0</span></div>
        <div>选中图层:<span class="val" id="selInfo">无</span></div>
    </div>
</div>

<div class="status-text" id="statusText">LayerList | 使用 arcgis-layer-list 组件管理图层</div>

<div id="mapContainer"></div>

<script type="module">
    const [Map, SceneView, FeatureLayer, GraphicsLayer, Graphic] = await $arcgis.import([
        "@arcgis/core/Map.js",
        "@arcgis/core/views/SceneView.js",
        "@arcgis/core/layers/FeatureLayer.js",
        "@arcgis/core/layers/GraphicsLayer.js",
        "@arcgis/core/Graphic.js"
    ]);
    const getTianditu = await $arcgis.import("https://openlayers.vip/examples/resources/tianditu.js");

    const vecLayers = getTianditu.default({ type: "vec_w" });
    const map = new Map({ basemap: { baseLayers: [vecLayers.base, vecLayers.anno] } });

    const view = new SceneView({
        container: "mapContainer", map: map,
        camera: {
            position: { longitude: 121.498, latitude: 31.205, z: 4000 },
            heading: 20, tilt: 60
        }
    });

    // ===== 图层 1:客户端要素图层(监测点,按类别唯一值着色) =====
    function buildMonitorLayer() {
        const cats = ["A类", "B类", "C类"];
        const colors = {
            "A类": [227, 74, 51],
            "B类": [56, 135, 220],
            "C类": [60, 180, 110]
        };
        const graphics = [];
        for (let i = 0; i < 90; i++) {
            const cat = cats[i % 3];
            graphics.push(new Graphic({
                geometry: {
                    type: "point",
                    x: 121.46 + Math.random() * 0.08,
                    y: 31.18 + Math.random() * 0.06,
                    z: 80 + Math.random() * 400,
                    spatialReference: { wkid: 4326 }
                },
                attributes: {
                    OBJECTID: i + 1,
                    NAME: "监测点" + (i + 1),
                    CATEGORY: cat
                }
            }));
        }
        return new FeatureLayer({
            source: graphics,
            objectIdField: "OBJECTID",
            fields: [
                { name: "OBJECTID", type: "oid" },
                { name: "NAME", type: "string" },
                { name: "CATEGORY", type: "string" }
            ],
            geometryType: "point",
            spatialReference: { wkid: 4326 },
            title: "实时监测点",
            elevationInfo: { mode: "relative-to-ground" },
            renderer: {
                type: "unique-value",
                field: "CATEGORY",
                uniqueValueInfos: cats.map(cat => ({
                    value: cat,
                    symbol: {
                        type: "point-3d",
                        symbolLayers: [{
                            type: "object",
                            resource: { primitive: "sphere" },
                            width: 220, height: 220, depth: 220,
                            material: { color: colors[cat] }
                        }]
                    }
                }))
            },
            popupTemplate: {
                title: "{NAME}",
                content: "类别:{CATEGORY}"
            }
        });
    }

    // ===== 图层 2:GraphicsLayer(三维建筑体) =====
    function buildBuildingLayer() {
        const layer = new GraphicsLayer({ title: "重点建筑体" });
        const bases = [
            { x: 121.490, y: 31.230, h: 900, c: [120, 170, 230] },
            { x: 121.495, y: 31.225, h: 1400, c: [230, 160, 70] },
            { x: 121.500, y: 31.220, h: 700, c: [120, 200, 160] },
            { x: 121.485, y: 31.218, h: 1100, c: [200, 120, 200] }
        ];
        bases.forEach((b, idx) => {
            layer.add(new Graphic({
                geometry: {
                    type: "point",
                    x: b.x, y: b.y, z: 0,
                    spatialReference: { wkid: 4326 }
                },
                symbol: {
                    type: "point-3d",
                    symbolLayers: [{
                        type: "object",
                        resource: { primitive: "cube" },
                        width: 350, depth: 350, height: b.h,
                        material: { color: b.c }
                    }]
                },
                attributes: { NAME: "建筑" + (idx + 1) }
            }));
        });
        return layer;
    }

    const monitorLayer = buildMonitorLayer();
    const buildingLayer = buildBuildingLayer();
    map.addMany([buildingLayer, monitorLayer]);

    // ===== 动态图层:按钮添加 / 移除的「监测区域」图层 =====
    let zoneLayer = null;
    function buildZoneLayer() {
        const graphics = [];
        for (let i = 0; i < 12; i++) {
            graphics.push(new Graphic({
                geometry: {
                    type: "point",
                    x: 121.47 + Math.random() * 0.05,
                    y: 31.19 + Math.random() * 0.04,
                    z: 200,
                    spatialReference: { wkid: 4326 }
                },
                attributes: { OBJECTID: i + 1, NAME: "区域点" + (i + 1) }
            }));
        }
        return new FeatureLayer({
            source: graphics,
            objectIdField: "OBJECTID",
            fields: [
                { name: "OBJECTID", type: "oid" },
                { name: "NAME", type: "string" }
            ],
            geometryType: "point",
            spatialReference: { wkid: 4326 },
            title: "临时监测区域",
            elevationInfo: { mode: "relative-to-ground" },
            renderer: {
                type: "simple",
                symbol: {
                    type: "point-3d",
                    symbolLayers: [{
                        type: "object",
                        resource: { primitive: "diamond" },
                        width: 260, height: 260, depth: 260,
                        material: { color: [255, 200, 0] }
                    }]
                }
            }
        });
    }

    // ===== LayerList 组件(arcgis-layer-list,组件优先,禁止改用 widget) =====
    const layerList = document.getElementById("layerList");
    layerList.view = view;                 // 独立组件需手动绑定 view
    layerList.selectionMode = "multiple";  // 5.0 用 selectionMode 控制选中能力(默认 "none")
    layerList.listItemCreatedFunction = (event) => {
        const item = event.item;
        // 为每个图层项追加「缩放到」操作按钮
        item.actionsSections = [[
            { type: "button", title: "缩放到图层", id: "zoom-to", icon: "magnifying-glass" }
        ]];
    };
    layerList.addEventListener("arcgisTriggerAction", (event) => {
        const { action, item } = event.detail;
        if (action.id === "zoom-to" && item.layer.fullExtent) {
            view.goTo(item.layer.fullExtent).catch(() => {});
            setStatus("已缩放到:" + item.title);
        }
    });
    layerList.addEventListener("arcgisPropertyChange", (event) => {
        if (event.detail.name === "selection") {
            const sel = layerList.selectedItems || [];
            document.getElementById("selInfo").textContent =
                sel.length ? sel.map(i => i.title).join("、") : "无";
        }
    });

    // ===== 图层数量随 map 变化自动刷新 =====
    function updateLayerCount() {
        document.getElementById("layerCount").textContent = view.map.layers.length;
    }
    view.map.layers.on("change", updateLayerCount);

    await view.when();
    updateLayerCount();
    await monitorLayer.when();
    view.goTo(monitorLayer.fullExtent, { duration: 1500 }).catch(() => {});
    setStatus("LayerList 组件就绪 | 共 " + view.map.layers.length + " 个图层");

    function setStatus(msg) { document.getElementById("statusText").textContent = msg; }

    // 添加 / 移除 监测区域图层(演示 LayerList 自动增删)
    document.getElementById("btnAdd").addEventListener("click", () => {
        if (zoneLayer) { setStatus("监测区域图层已存在"); return; }
        zoneLayer = buildZoneLayer();
        map.add(zoneLayer);
        setStatus("已添加临时监测区域图层");
    });
    document.getElementById("btnRemove").addEventListener("click", () => {
        if (!zoneLayer) { setStatus("没有可移除的监测区域图层"); return; }
        map.remove(zoneLayer);
        zoneLayer = null;
        setStatus("已移除临时监测区域图层");
    });

    // 选中模式开关
    let selectOn = true;
    document.getElementById("btnSelect").addEventListener("click", function () {
        selectOn = !selectOn;
        layerList.selectionMode = selectOn ? "multiple" : "none";
        this.classList.toggle("on", selectOn);
        setStatus(selectOn ? "已开启选中模式" : "已关闭选中模式");
    });

    // 状态指示器开关
    let statusOn = true;
    document.getElementById("btnStatus").addEventListener("click", function () {
        statusOn = !statusOn;
        layerList.visibleElements = { statusIndicators: statusOn };
        this.classList.toggle("on", statusOn);
        setStatus(statusOn ? "已显示状态指示器" : "已隐藏状态指示器");
    });
</script>
</body>
</html>
五、在线示例
🔗 在线体验:https://southjor.github.io/arcgis-examples/lessons/lesson39.html
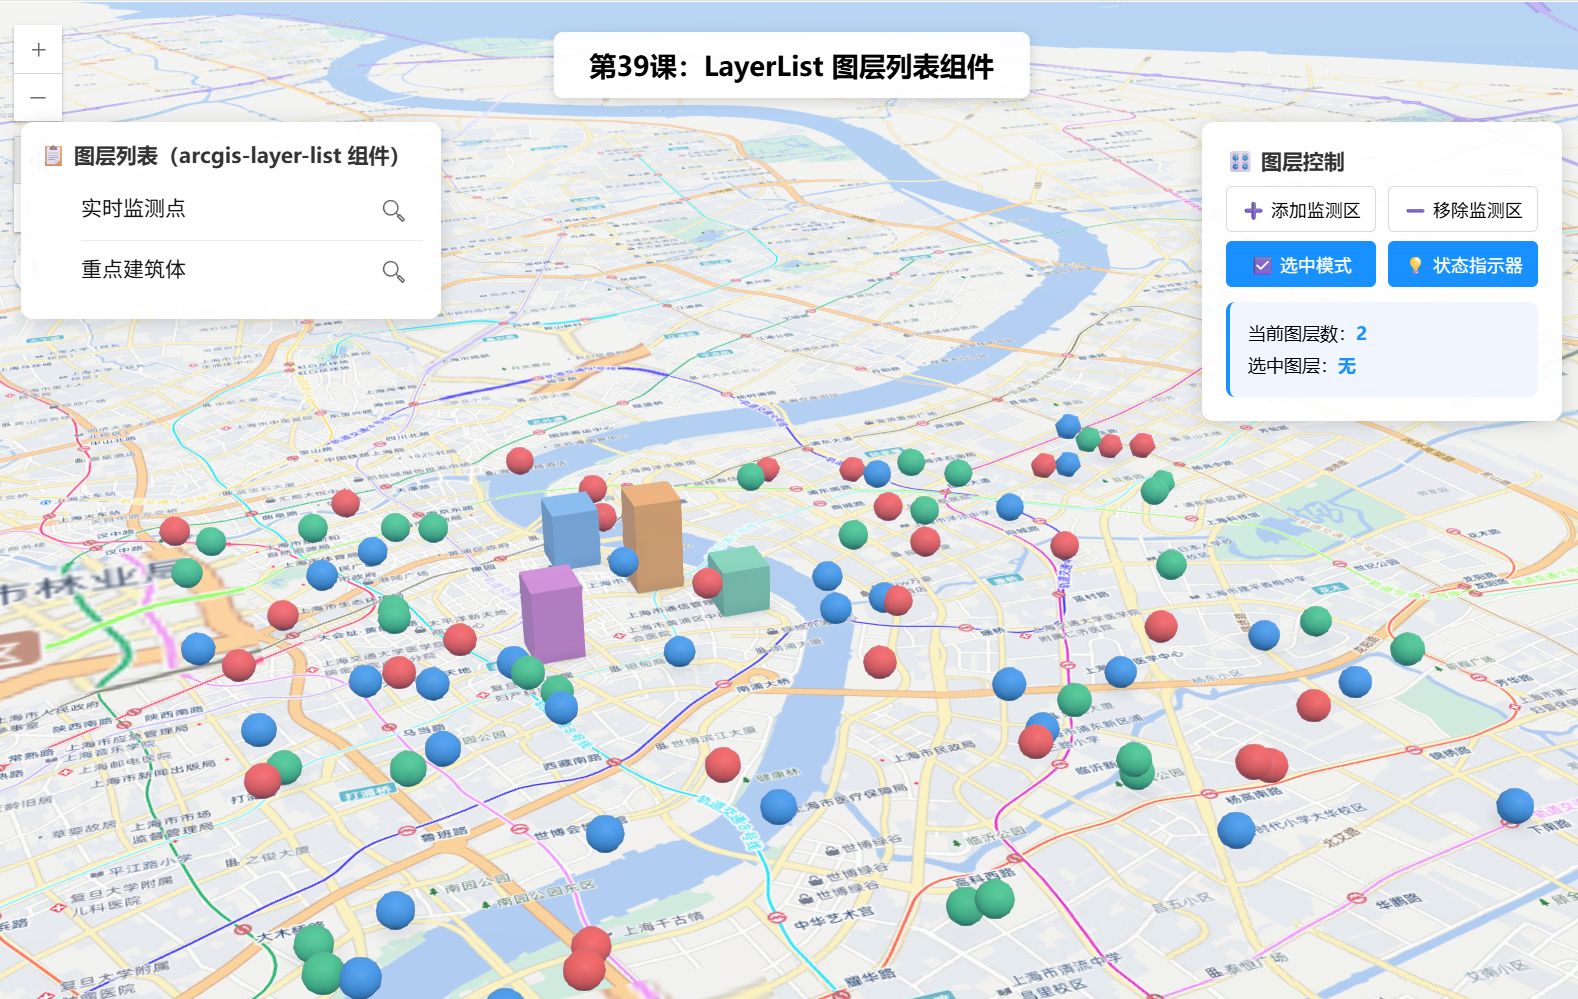
操作说明:
- 左侧面板即
<arcgis-layer-list>组件,列出场景中所有图层,可勾选开关可见性、拖拽调顺序。- 每个图层项右侧有「缩放到图层」按钮,点击让相机飞向该图层范围。
- 右侧「添加监测区 / 移除监测区」动态增删图层,列表自动同步。
- 「选中模式」开启后可在列表中多选图层;「状态指示器」控制加载状态图标的显隐。
六、关键 API 说明
| API | 说明 |
|---|---|
<arcgis-layer-list> | 图层列表 Web Component(组件优先,禁止改用 LayerList widget) |
layerList.view | 独立使用时手动绑定视图 |
layerList.selectionMode | 选中模式:"none"(默认)| "single" | "multiple" | "single-persist"(5.0 没有 selectionEnabled);配合 selectedItems 读取选中项 |
layerList.visibleElements | 控制可见元素(如 statusIndicators 状态指示器) |
layerList.listItemCreatedFunction | 每个列表项创建时回调,用于追加自定义操作 |
item.actionsSections | 列表项右侧的操作按钮数组 |
arcgisTriggerAction 事件 | 点击列表项操作按钮时触发,event.detail 含 action / item |
view.map.layers.on("change") | 监听图层增删,用于同步外部计数显示 |
参考链接: arcgis-layer-list 组件文档
七、系列导航
💡 小贴士:
<arcgis-layer-list>与<arcgis-scene>是同一套 Web Components 体系,若把<arcgis-layer-list slot="top-right">直接写在<arcgis-scene>内部,它会自动继承视图,连layerList.view = view都不用写。本课演示「独立面板」写法,便于把它放进任意自定义布局中。
转载自 CSDN-专业IT技术社区
原文链接:https://blog.csdn.net/linzi19900517/article/details/166340987