

前言
我用 Prometheus 久了以后,越来越觉得真正难监控的往往不是 CPU、内存和磁盘,而是业务里那些“只有自己才知道重要”的数字:队列里还压着多少任务、某个目录积了多少待处理文件、一个脚本到底有没有继续产出结果。系统指标正常,并不代表业务一定正常。如果这些数据只存在文件、数据库或者程序变量里,Prometheus 默认当然看不到,关键是先把它们转换成 Prometheus 能抓取的 /metrics。对我来说,自定义监控真正有价值的地方,就是把原来只能靠人工登录服务器确认的业务状态,变成可以持续采集、查询、留历史、设阈值的数字。我也会先分清“指标有了”和“告警真的送到了”是不是同一件事。
这次我用 Python 的 prometheus_client 从最简单的固定 Gauge 开始,先在 8001 暴露 app_pending_tasks=42,再升级成读取 /tmp/pending_tasks.txt 的动态指标,并配置 >50 持续 2m 的告警;第三步继续把场景换成目录文件积压,在 8003 暴露带 directory 标签的 file_queue_pending_count,模拟 150 个文件验证 >100 持续 5m 的规则。最后再用 cpolar 把内网 Exporter 提供成公网地址,让另一套 Prometheus 也能抓取。整篇我更关注“数据怎么变成指标、指标怎么进入 Prometheus、规则到底验证到了哪一步”,而不是把自定义监控简单理解成多写一段 Python。
1. 自定义指标真正解决什么问题
Prometheus 默认擅长抓系统和基础设施指标,但很多业务状态并不会自动出现在 Node Exporter 或系统监控里。
比如:
- 当前待处理任务数量;
- 队列积压;
- 某个目录里还没消费的文件数;
- API 成功率;
- 脚本执行状态。
这类数据的共同点是:
程序能读到,但 Prometheus 默认不知道。
解决办法不是让 Prometheus 直接去理解所有业务,而是在业务和 Prometheus 之间加一层 Exporter:
业务数据 → Exporter → /metrics → Prometheus → 告警规则。
后面三组实验都围绕这条链展开。
一、入门:先把一个固定值暴露成 Prometheus 指标
2. 准备 Python 和 prometheus_client
先建一个测试目录:
mkdir /ceshi
检查 Python 和 prometheus_client:
python3 --version
python3 -c "import prometheus_client; print('OK')"

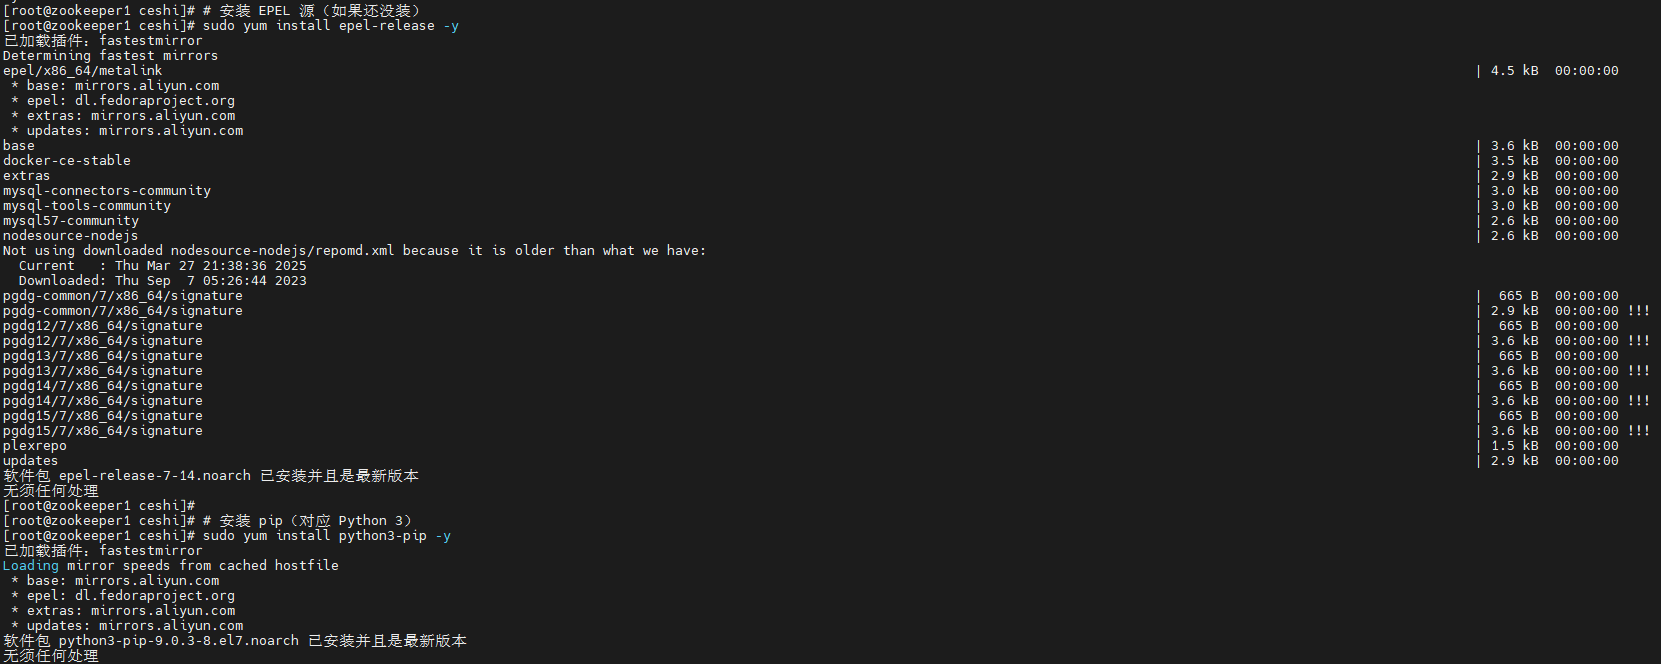
如果当前环境还没有 Python3 和 pip,执行:
sudo yum install epel-release -y
sudo yum install python3-pip -y
安装 Python 客户端库:
pip install prometheus_client

这里真正需要的是:
prometheus_client
后面的 Gauge、HTTP 指标服务都由它提供。
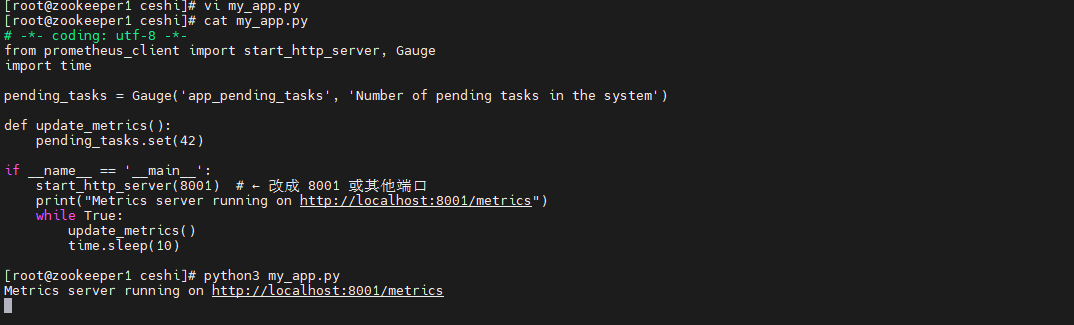
3. 第一个 Exporter:先固定返回 42
创建:
my_app.py
vi my_app.py
写入:
# -*- coding: utf-8 -*-
from prometheus_client import start_http_server, Gauge
import time

pending_tasks = Gauge('app_pending_tasks', 'Number of pending tasks in the system')

def update_metrics():
    pending_tasks.set(42)

if __name__ == '__main__':
    start_http_server(8001)  # ← 改成 8001 或其他端口
    print("Metrics server running on http://localhost:8001/metrics")
    while True:
        update_metrics()
        time.sleep(10)
这段脚本只做三件事:
- 定义 Gauge:
app_pending_tasks; - 每次更新都把它设为
42; - 在
8001启动/metricsHTTP 服务。
它还不是真实业务采集,只是先验证:
Python 能不能把一个数转换成 Prometheus 格式。
4. 启动并检查 /metrics
执行:
python my_app.py
访问:
http://ip:8001/metrics
页面里会出现:
# HELP app_pending_tasks Number of pending tasks in the system
# TYPE app_pending_tasks gauge
app_pending_tasks 42.0
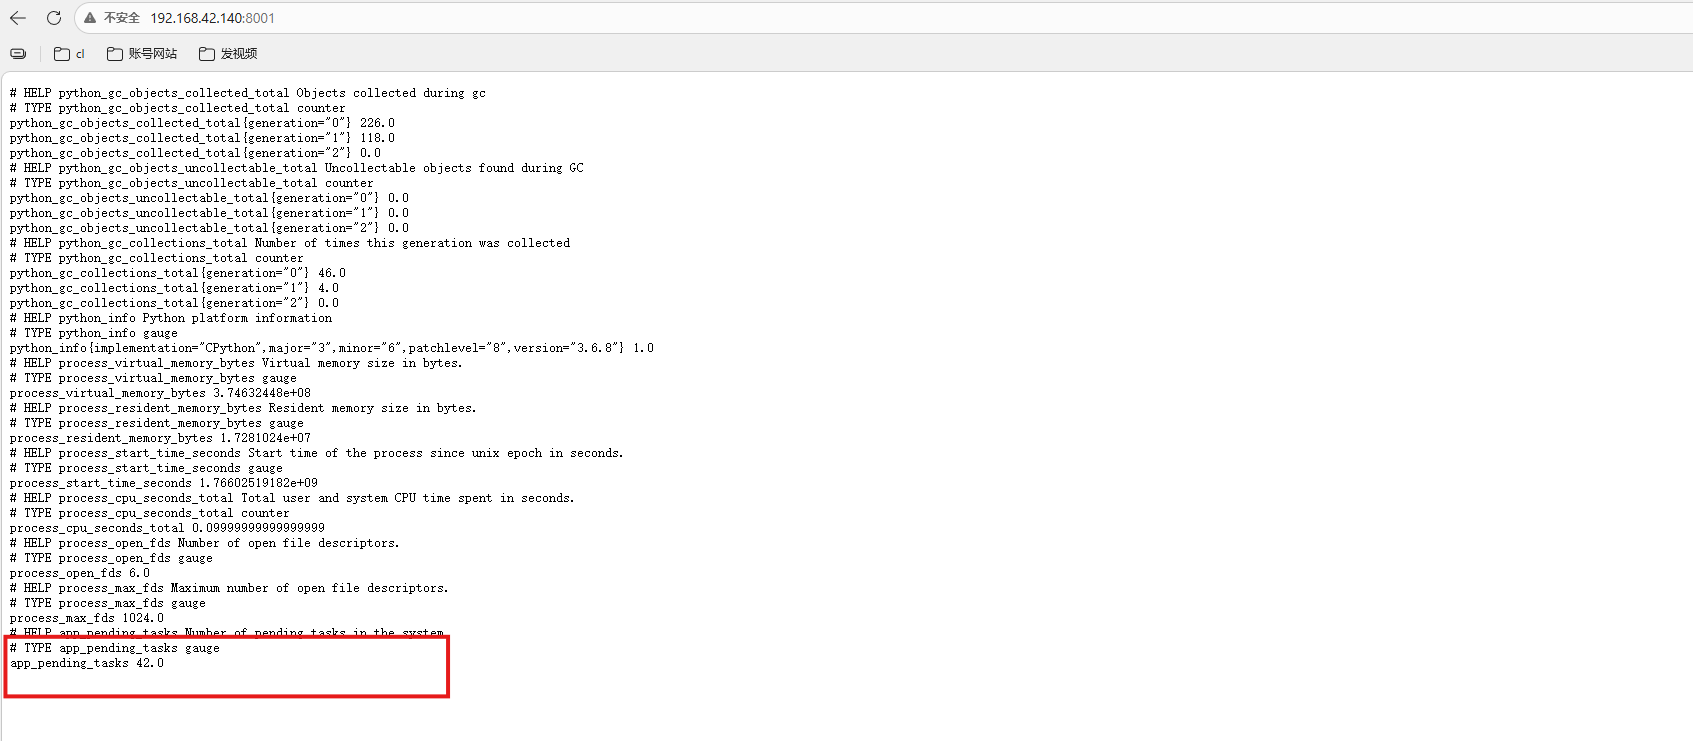
到这里第一层已经成立:
普通 Python 变量 → Gauge → /metrics。
# HELP、# TYPE 和指标值已经是 Prometheus 能识别的暴露格式。
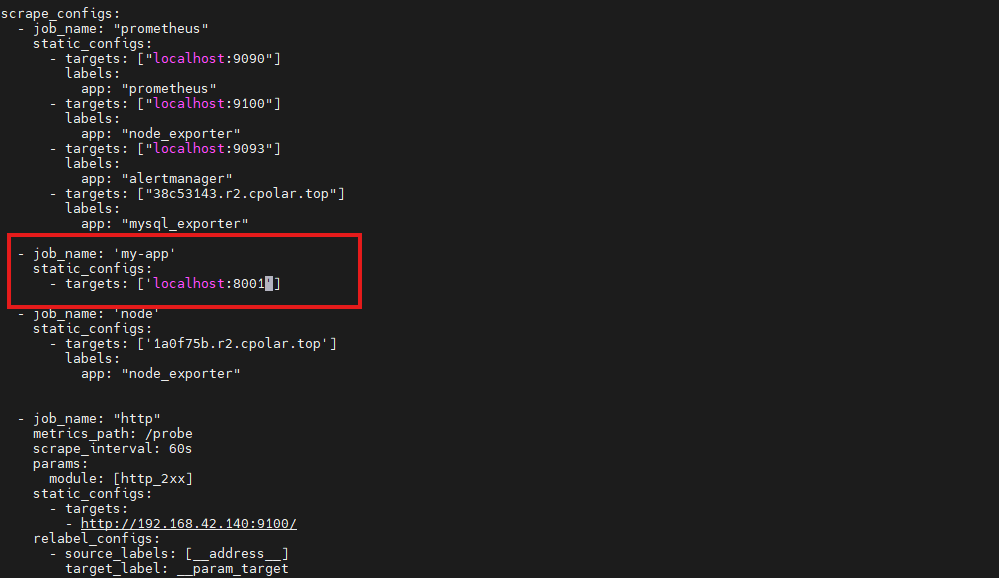
5. 把 8001 加进 Prometheus
编辑:
vi prometheus.yml
加入:
  - job_name: 'my-app'
    static_configs:
      - targets: ['localhost:8001']
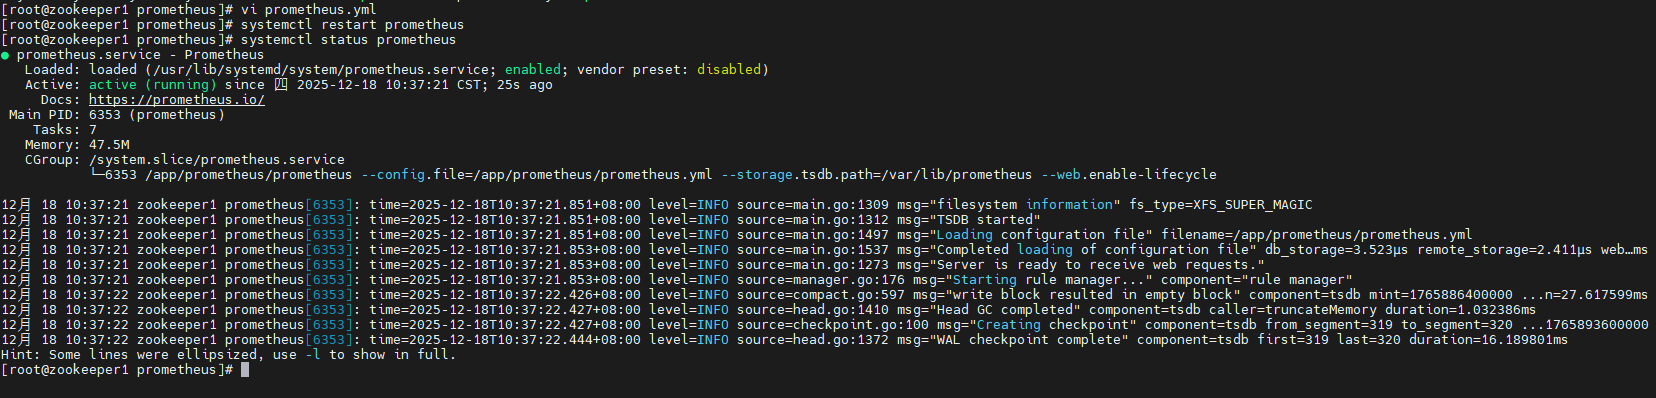
保存后重启 Prometheus:
systemctl restart prometheus
打开 Prometheus Web UI,一般通过:
http://ip:9090
搜索:
app_pending_tasks
就能看到当前值 42。
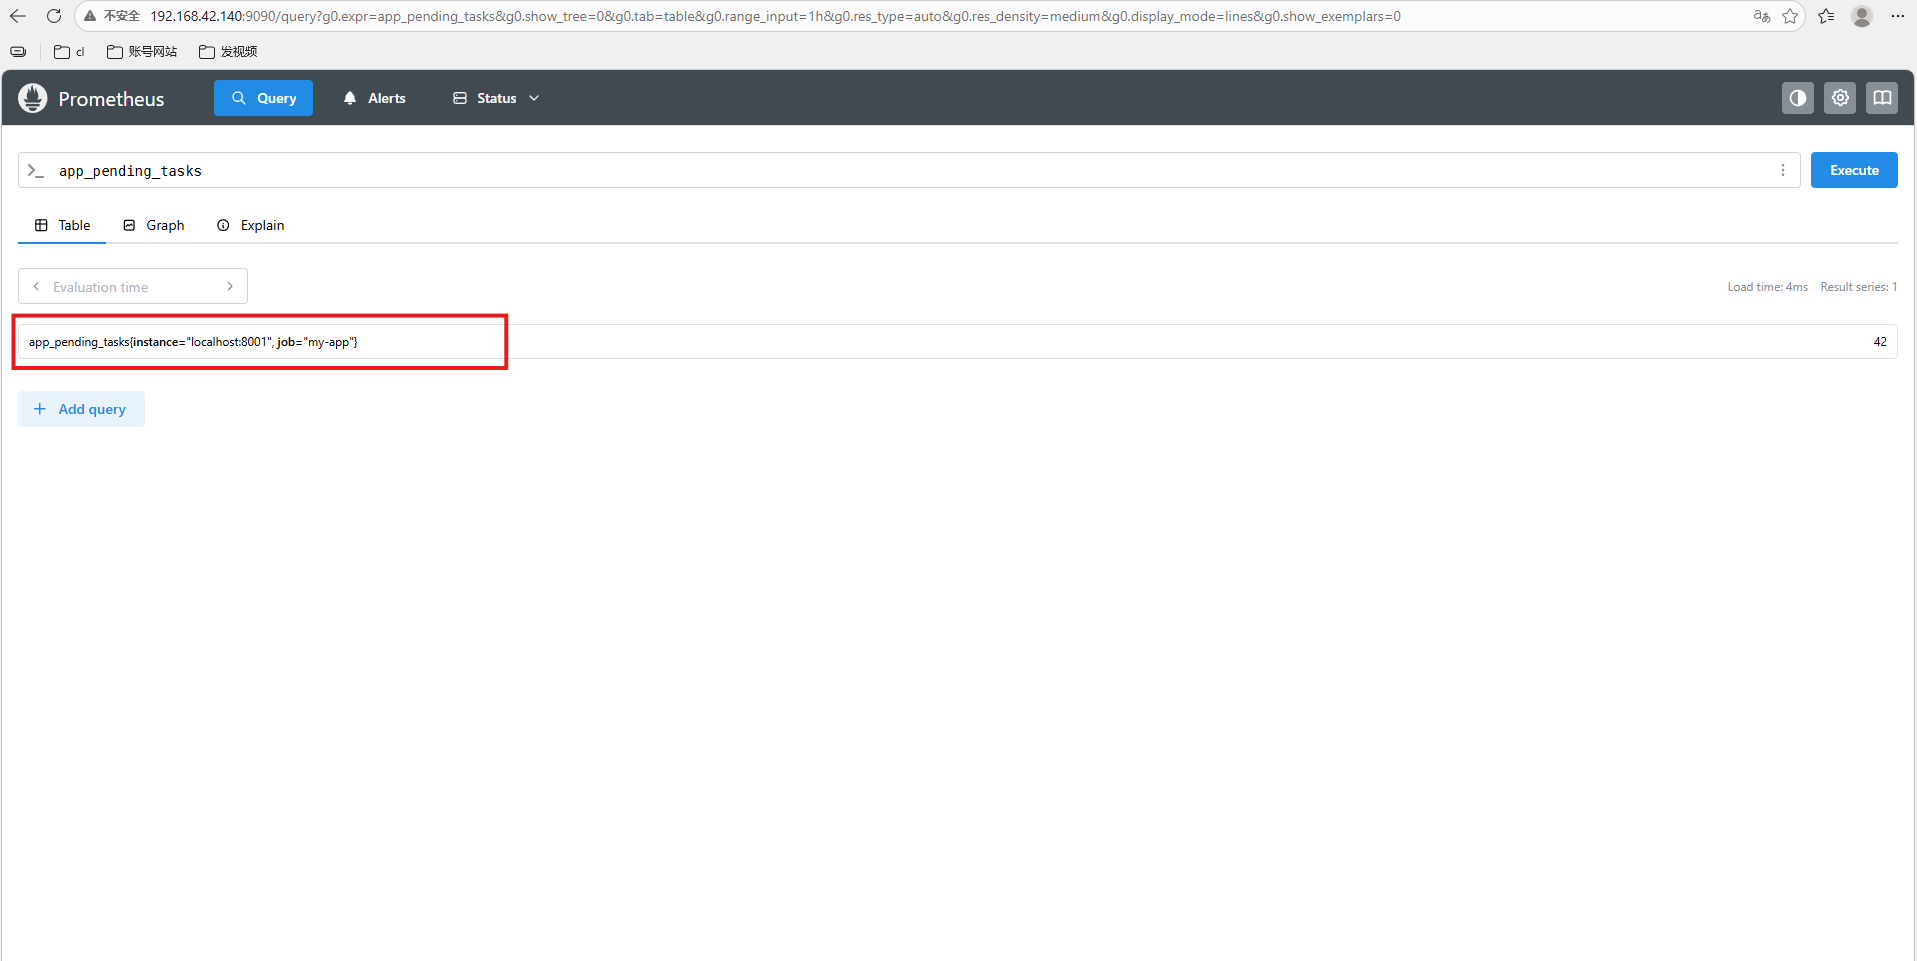
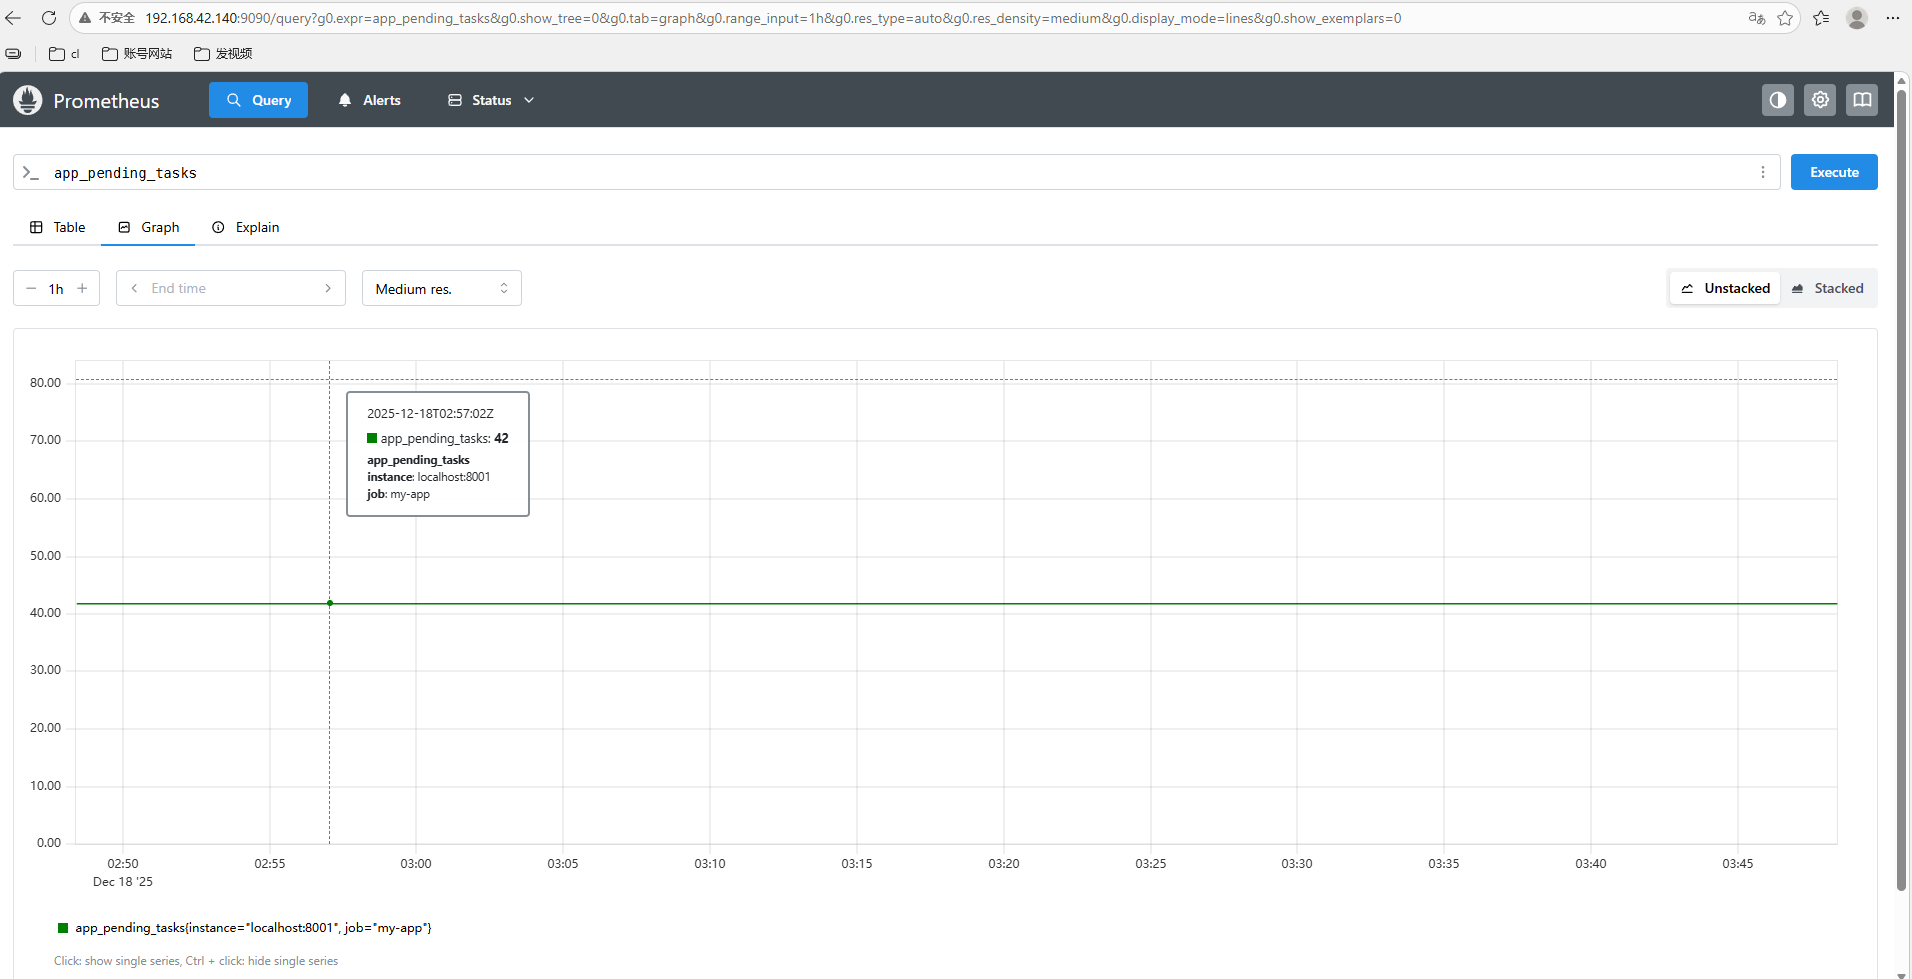
这一段的意义不是“42 有什么业务价值”,而是把最短路径跑通:
Exporter → Prometheus 抓取 → PromQL 查询。
二、进阶:把固定值换成真正会变化的业务数据
6. 第二个场景:监控待处理任务数
固定写死 42 只能证明技术链路。
下一步把数据放进:
/tmp/pending_tasks.txt
假设业务程序不断更新这个文件,Prometheus 需要看到它当前的值。
目标是:
pending_tasks > 50 持续 2 分钟时进入告警状态。
整体链路是:
[你的脚本]
   ↓ (暴露 /metrics)
[Prometheus] ← 抓取指标
   ↓ (评估规则)
[Alertmanager] ← 发送告警
   ↓
[你收到通知]
这里需要把“规则触发”和“通知送达”区分开。
后面实际展示了 Prometheus 中的告警规则和告警状态,但没有继续给出 Alertmanager 接收端、路由和通知渠道配置,所以这篇真正验证到的是:
指标采集 → Prometheus 规则评估 → 告警状态。
Alertmanager 发送通知属于这套架构的下一层,但当前步骤没有完整展开。
7. 创建动态数据文件
先写一个初始值:
echo 42 > /tmp/pending_tasks.txt
然后创建新的 task_exporter.py。
脚本内容是:
# -*- coding: utf-8 -*-
from prometheus_client import start_http_server, Gauge
import time
import os

# 定义指标
pending_tasks = Gauge('app_pending_tasks', 'Number of pending tasks from /tmp/pending_tasks.txt')

def read_pending_tasks():
    """从文件读取当前待处理任务数"""
    try:
        with open('/tmp/pending_tasks.txt', 'r') as f:
            value = int(f.read().strip())
            return value
    except Exception as e:
        print(f"Error reading file: {e}")
        return 0  # 文件不存在或格式错误时返回 0

def update_metrics():
    count = read_pending_tasks()
    pending_tasks.set(count)
    print(f"Updated pending_tasks = {count}")

if __name__ == '__main__':
    start_http_server(8002)
    print("Task Exporter running on :8002/metrics")
    while True:
        update_metrics()
        time.sleep(15)  # 每15秒更新一次
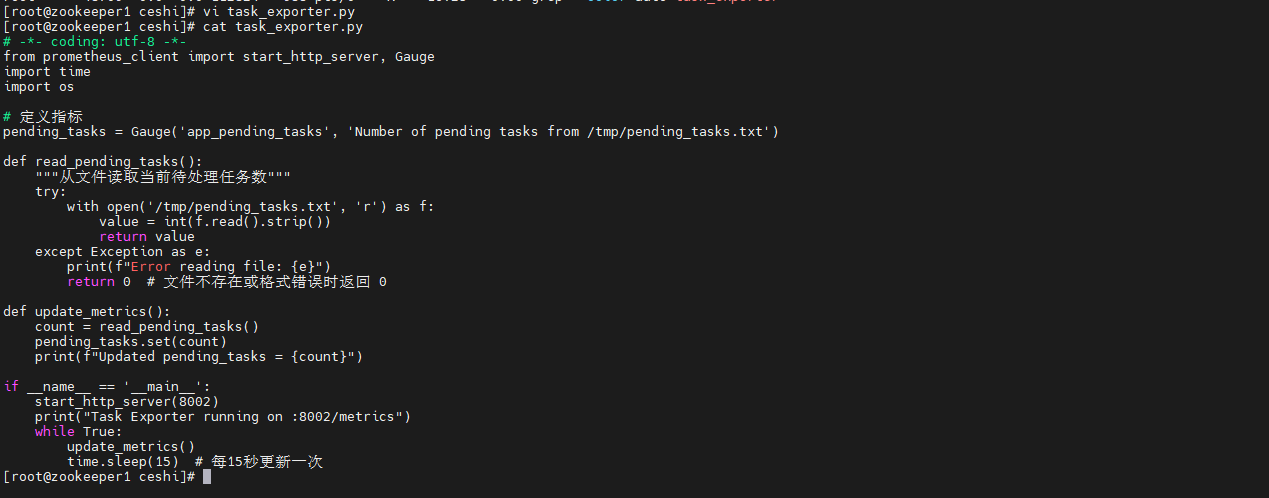
这次和第一个脚本有三个明显变化:
- 指标仍叫
app_pending_tasks; - 数据不再固定,而是读取
/tmp/pending_tasks.txt; - Exporter 端口变成
8002; - 每
15秒读取一次文件并更新 Gauge。
如果文件不存在或内容不能转换为整数,脚本当前逻辑会返回 0。
8. 启动动态 Exporter
执行:
python3 task_exporter.py &

接着把测试值改成 60,再检查指标:
# 先模拟数据
echo 60 > /tmp/pending_tasks.txt

# 查看指标
curl http://localhost:9100/metrics | grep app_pending_tasks

这里有一处端口需要特别注意。
task_exporter.py 明确启动在:
8002
后面浏览器验证同样访问:
http://ip:8002/metrics
但当前这条 curl 命令写的是:
localhost:9100
两处端口并不一致。
我会保留现有命令,同时在排查“curl 为什么查不到 app_pending_tasks”时,先核对 Exporter 实际监听端口,不直接把问题归到 Prometheus。
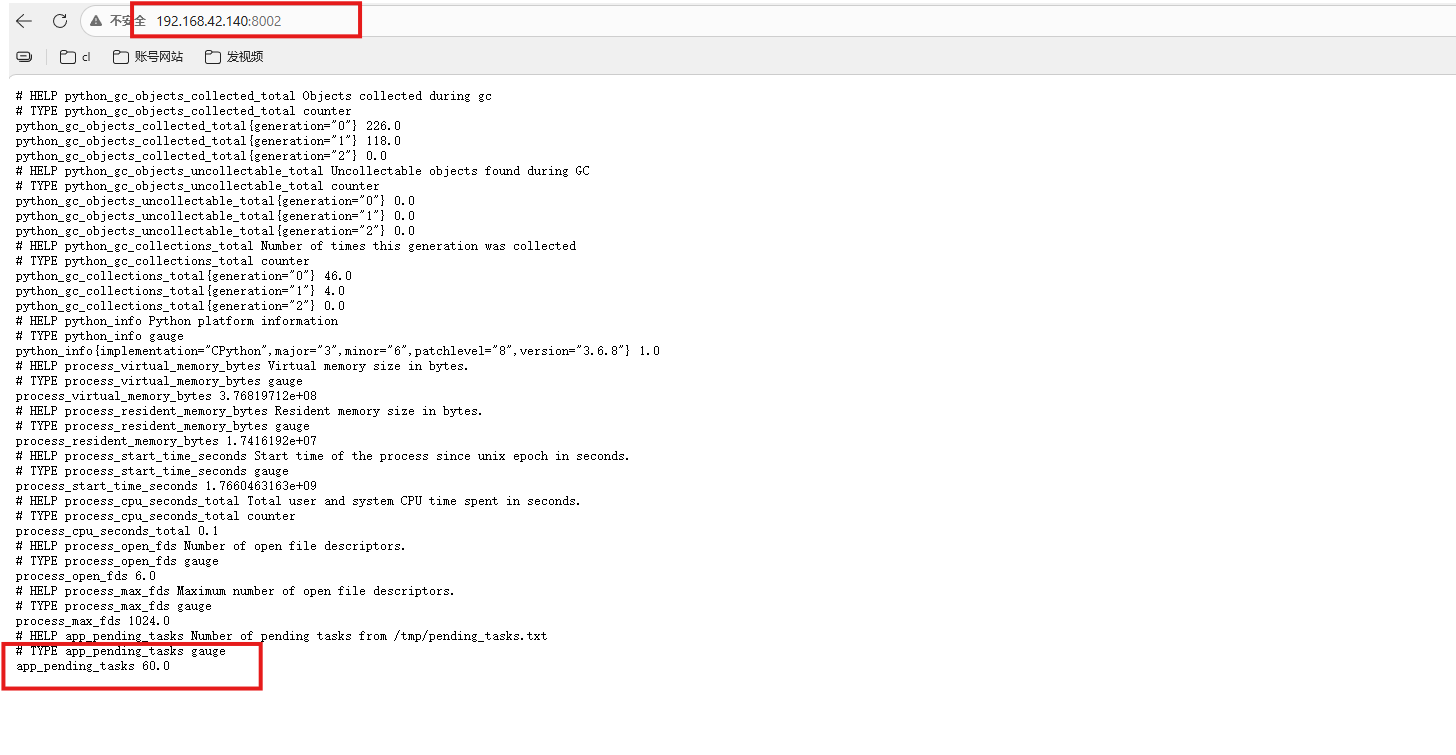
浏览器访问 8002 后,当前指标为:
app_pending_tasks 60.0
9. Prometheus 抓取 8002
加入:
  - job_name: 'task'
    static_configs:
      - targets: ['localhost:8002']
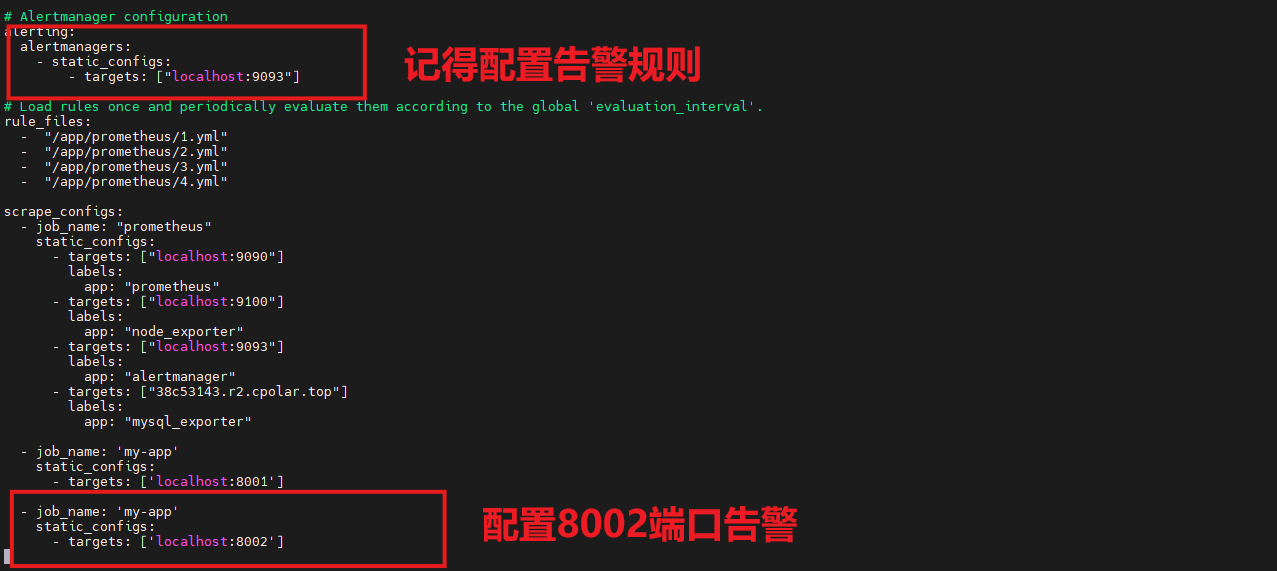
这样 Prometheus 会从:
localhost:8002
抓取动态 app_pending_tasks。
10. 为任务积压加规则
创建:
vi alert_rules.yml
规则内容:
groups:
- name: task_alerts
  rules:
  - alert: HighPendingTasks
    expr: app_pending_tasks > 50
    for: 2m                # 持续 2 分钟超过 50 才触发
    labels:
      severity: warning
    annotations:
      summary: "待处理任务过多"
      description: "当前待处理任务数为 {{ $value }},超过阈值 50"
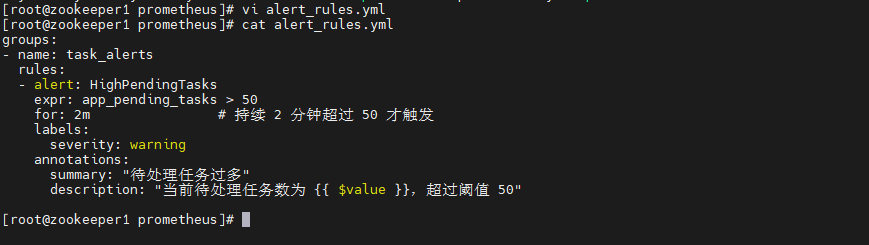
这里的判断条件非常明确:
app_pending_tasks > 50 持续 2m。
也就是说,短暂跳到 60 不会立刻满足 for: 2m 的持续条件。
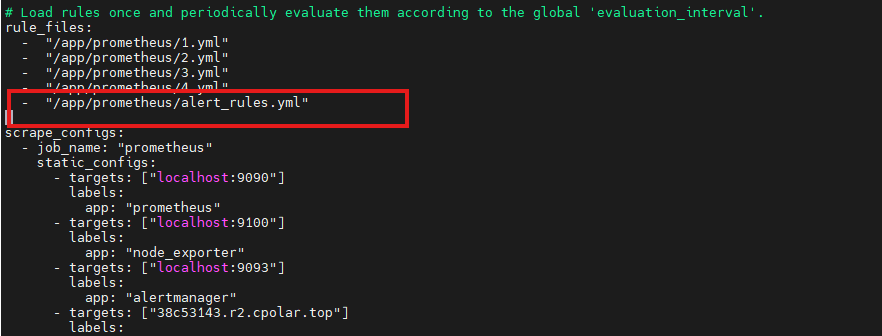
还需要把这个规则文件加入 Prometheus 配置。
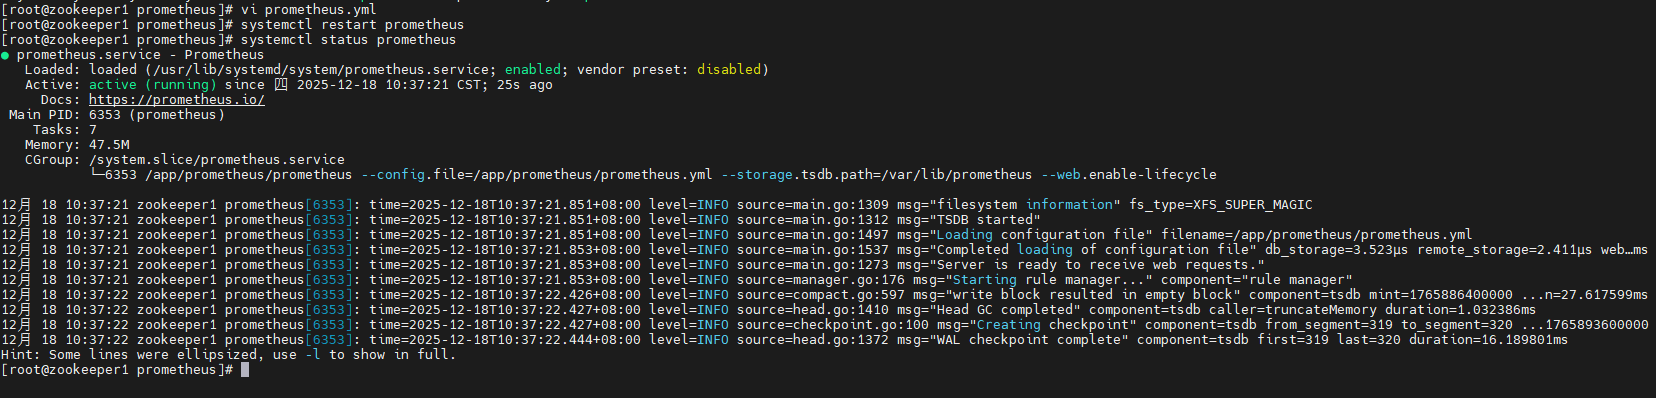
然后重启:
systemctl restart prometheus
当前测试文件里已经写入 60,Prometheus 页面可以看到对应规则进入告警状态。
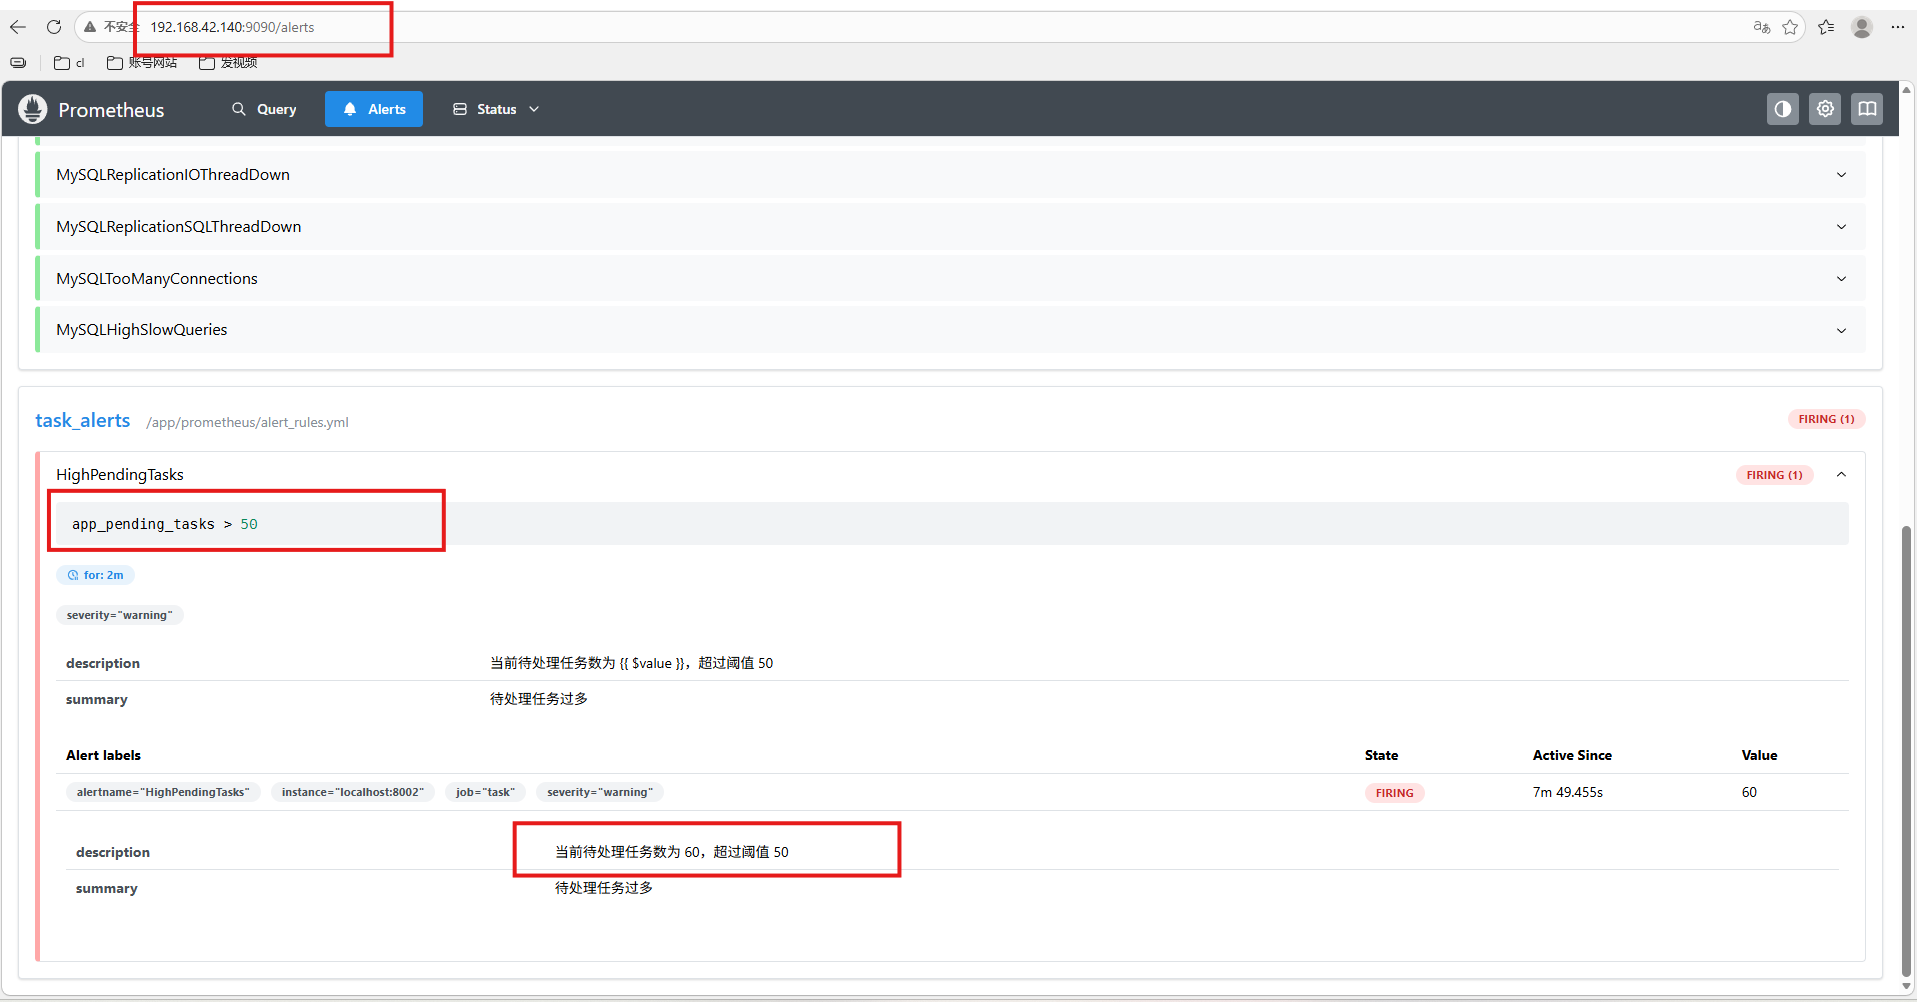
到这里,第二层从“能抓值”升级为:
动态文件 → Exporter → Prometheus → 阈值规则。
三、高级:用标签监控多个目录的文件积压
11. 为什么目录积压比 CPU 更接近业务问题
第三个场景更像真实生产逻辑。
假设外部程序持续向:
/data/incoming/
写入 .json、.csv 等文件,另一个消费者处理完以后再把它们移走。
如果消费者挂了或者变慢,CPU 可能看起来完全正常,但:
/data/incoming/ 文件会越堆越多。
这时真正有价值的业务指标是:
待处理文件数量
目标条件是:
文件数 > 100 持续 5 分钟。
这类指标不能靠传统 CPU / 内存直接推断,却能很直观地反映处理链路是否堵住。
12. 创建带 directory 标签的 Exporter
file_queue_exporter.py 内容如下:
# -*- coding: utf-8 -*-
# file_queue_exporter.py
from prometheus_client import start_http_server, Gauge
import os
import time
import glob

# 自定义指标:带标签(directory)
pending_files = Gauge(
    'file_queue_pending_count',
    'Number of pending files in a directory',
    ['directory']
)

# 要监控的目录列表(可扩展)
WATCHED_DIRS = [
    "/data/incoming",
    "/logs/upload_queue"
]

def count_pending_files():
    for dir_path in WATCHED_DIRS:
        if not os.path.exists(dir_path):
            count = 0
        else:
            # 只统计普通文件(不含子目录)
            files = [f for f in glob.glob(os.path.join(dir_path, "*")) if os.path.isfile(f)]
            count = len(files)
        pending_files.labels(directory=dir_path).set(count)
        print(f"[{time.strftime('%Y-%m-%d %H:%M:%S')}] {dir_path} → {count} files")

if __name__ == '__main__':
    start_http_server(8003)
    print("File Queue Exporter running on :8003/metrics")
    while True:
        count_pending_files()
        time.sleep(30)  # 每30秒采集一次
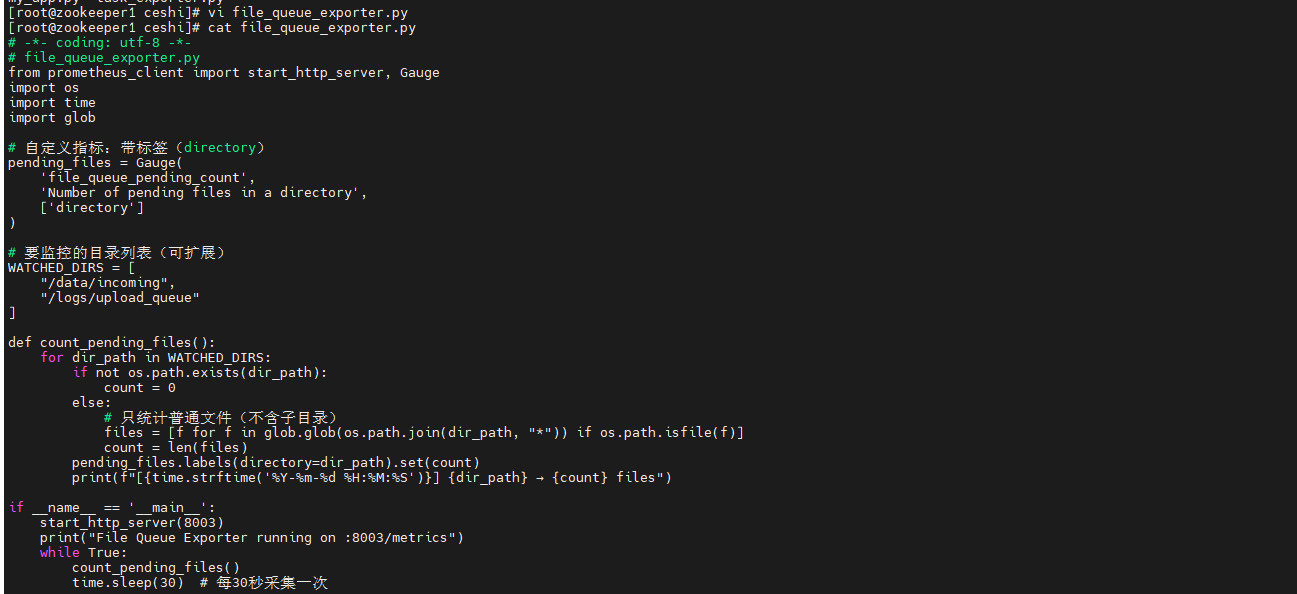
这次指标名变成:
file_queue_pending_count
并且增加了标签:
directory
监控目录当前包括:
/data/incoming/logs/upload_queue
Exporter 监听:
8003
每 30 秒统计一次。
有了 directory 标签以后,同一个指标就能同时表示多个目录,不必为每个目录重新定义一个新指标名。
13. 创建目录并启动脚本
当前命令为:
mkdir -p /data/incoming /logs/upload_queue python3 file_queue_exporter.py &

这行里把:
mkdir -p /data/incoming /logs/upload_queue
和:
python3 file_queue_exporter.py &
写在了同一行,但中间没有显式的命令连接符。
我不改这条命令本身。实际执行后需要确认 file_queue_exporter.py 是否真的已经启动,并进一步检查 8003/metrics,不要只看到目录创建成功就认为 Exporter 也已经运行。
14. 让 Prometheus 抓取 8003
配置:
  - job_name: 'file'
    static_configs:
      - targets: ['localhost:8003']

对应 job 是:
file
目标是:
localhost:8003
15. 给文件积压加告警规则
规则内容:
groups:
- name: file-queue-alerts
  rules:
  - alert: HighFileQueuePending
    expr: file_queue_pending_count{directory="/data/incoming"} > 100
    for: 5m
    labels:
      severity: warning
    annotations:
      summary: "待处理文件积压过多"
      description: "目录 {{ $labels.directory }} 中有 {{ $value | printf \"%.0f\" }} 个待处理文件,超过阈值 100"
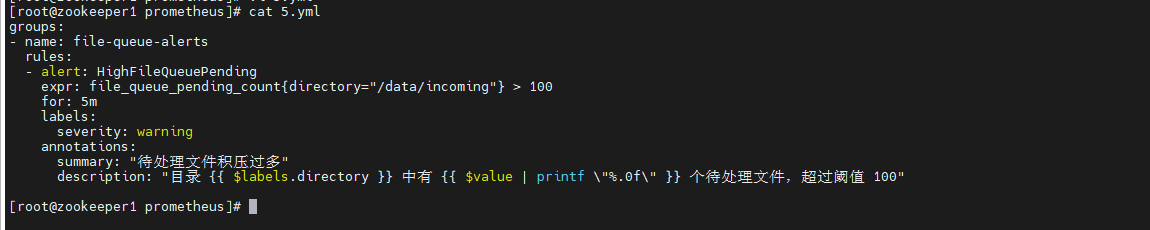
这里监控的是:
directory="/data/incoming"
触发条件为:
file_queue_pending_count > 100 持续 5m。
告警说明中还会带:
- 当前目录;
- 当前文件数量;
- 阈值
100。
把规则文件加入 Prometheus 配置。
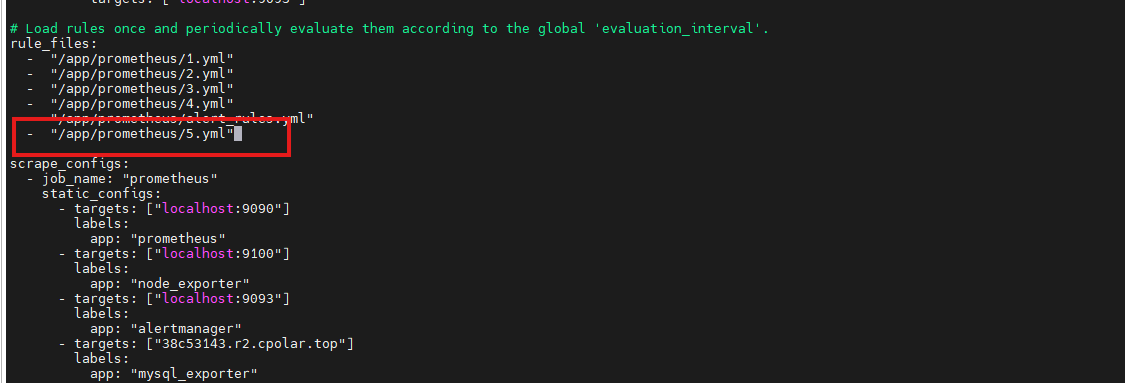
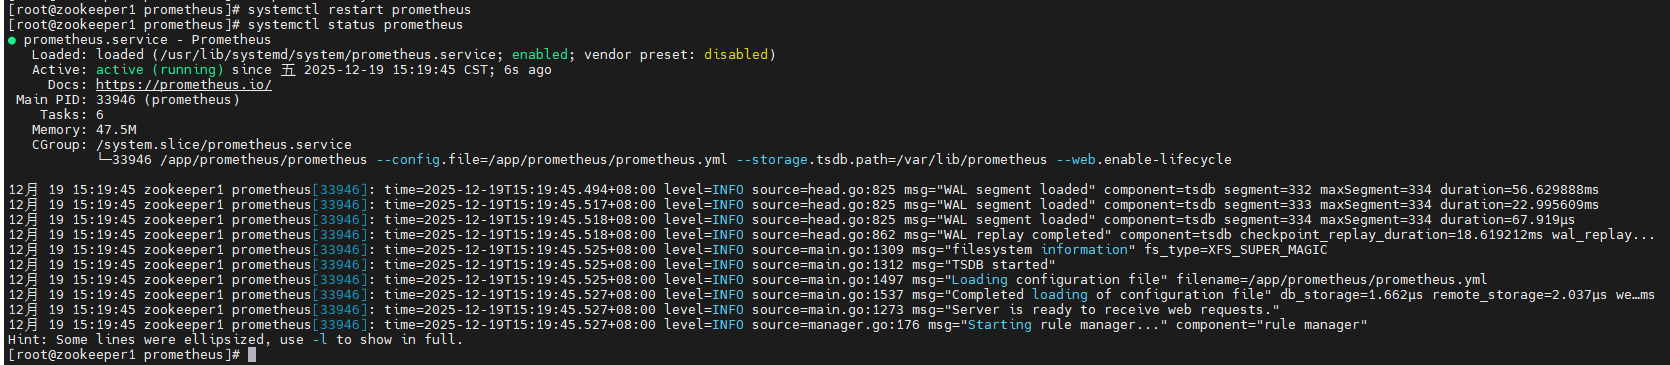
然后重启并查看 Prometheus:
systemctl restart prometheus
systemctl status prometheus
页面里可以看到规则已经载入。
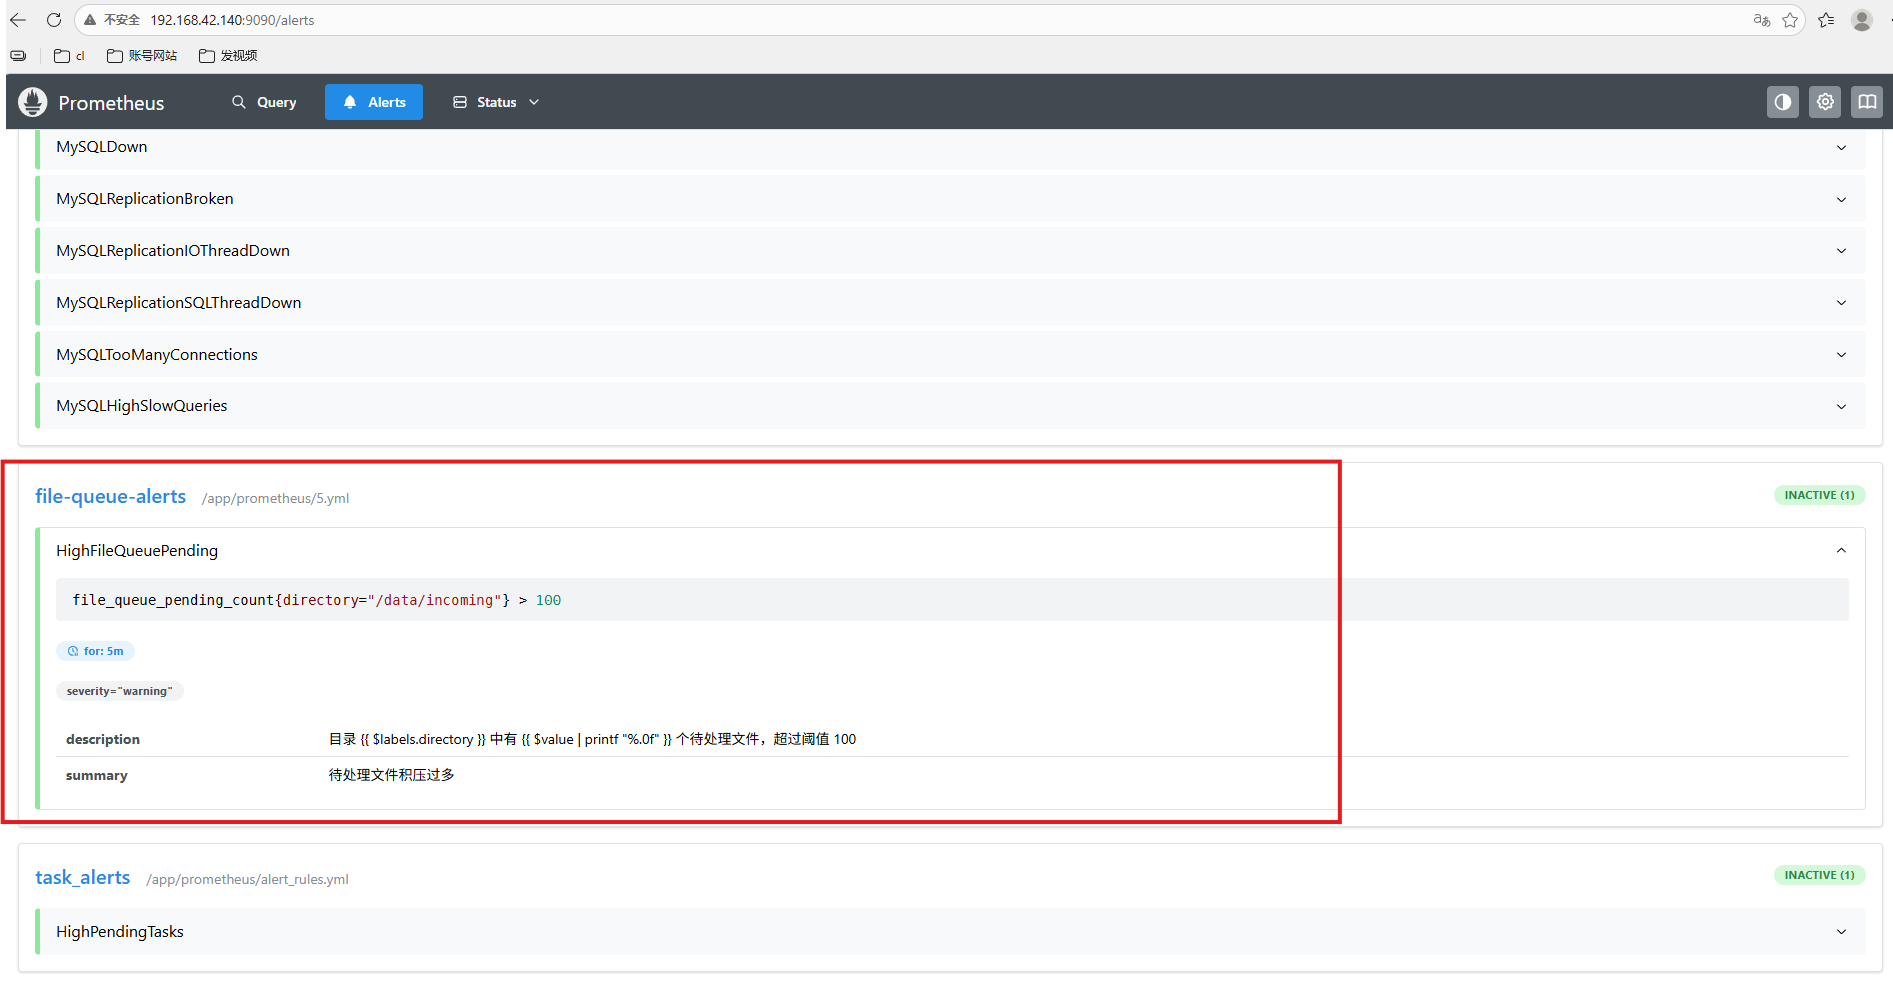
16. 手动制造 150 个文件,验证指标变化
先确认目录:
ls /data/incoming
然后创建 150 个 .json 文件:
for i in {1..150}; do
    touch /data/incoming/data_${i}.json
done
检查:
ls -l /data/incoming

再查看 8003 Exporter 当前指标:
curl http://localhost:8003/metrics | grep file_queue_pending_count

这一步确认的是:
目录里的文件数量已经被转换成 file_queue_pending_count。
最后回 Prometheus Web UI 查看。
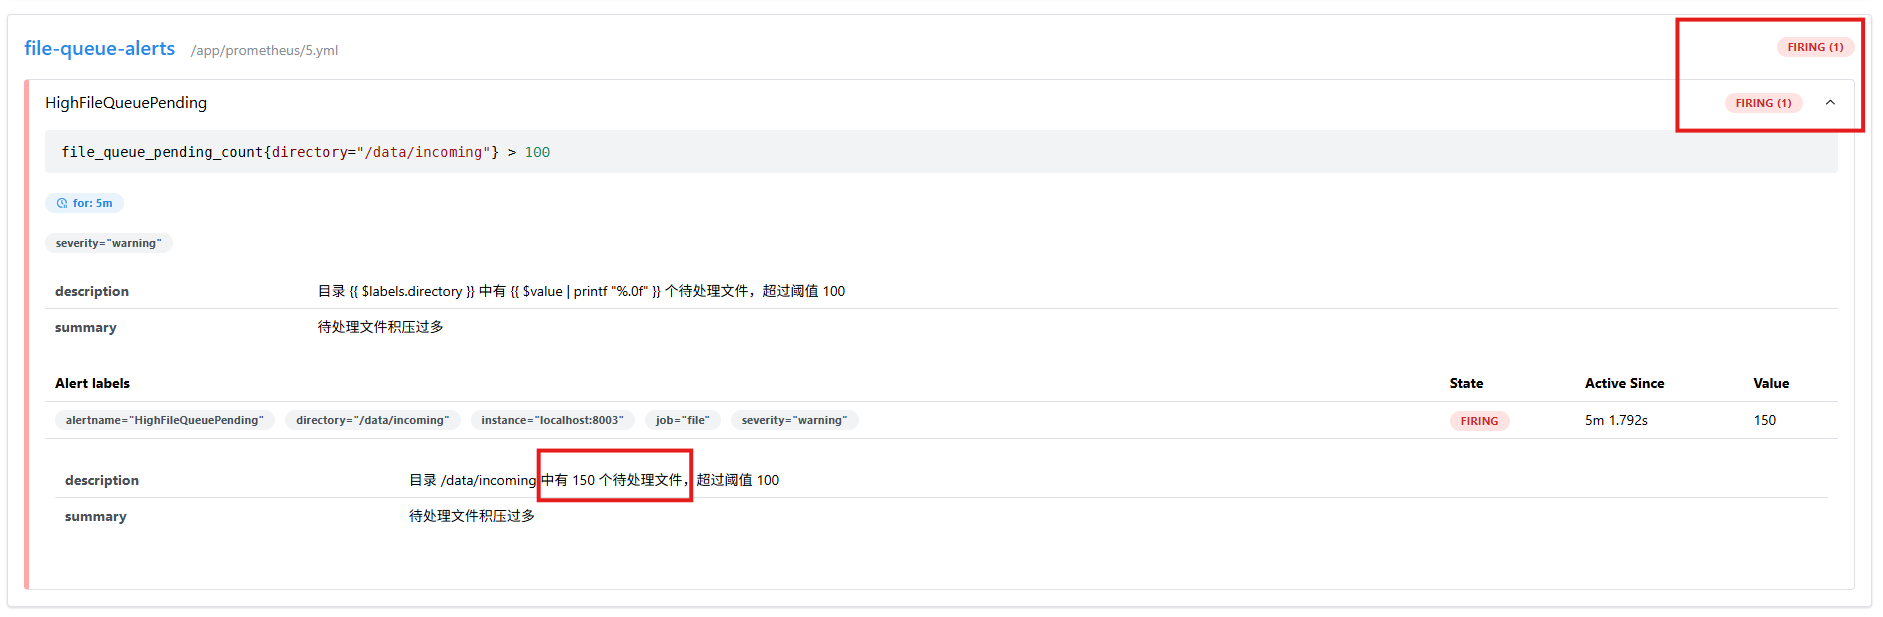
因为测试值已经超过 100,规则会进入对应告警流程;当前规则还设置了 for: 5m,是否进入最终 firing 状态取决于条件持续时间。
到这里第三层已经把自定义指标从“一个数”提升成:
动态业务对象 + 标签 + 阈值 + 持续时间。
四、内网 Exporter 不在 Prometheus 身边怎么办
17. 跨网络监控,本质上缺的是抓取路径
前面的三个 Exporter 都假设:
Prometheus 能直接访问它们。
但真实环境很常见的一种情况是:
- Exporter 在公司内网;
- Prometheus 在家里、另一处机房或其他网络;
- 两边没有直接路由。
这时指标本身已经有了,缺的是:
Prometheus 到 /metrics 的网络入口。
这里再加入 cpolar。
cpolar 不生成 Prometheus 指标,也不评估告警规则,它只负责把当前 Exporter 的 HTTP 服务提供成公网可访问入口。
18. 安装 cpolar
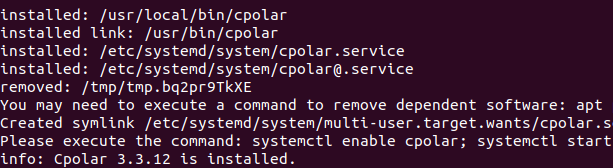
执行:
sudo curl https://get.cpolar.sh | sh
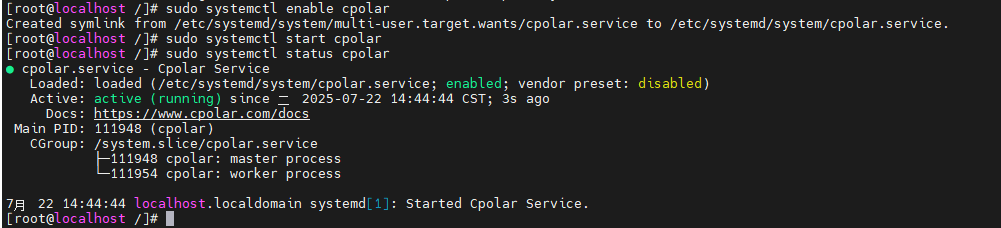
查看服务状态:
sudo systemctl status cpolar
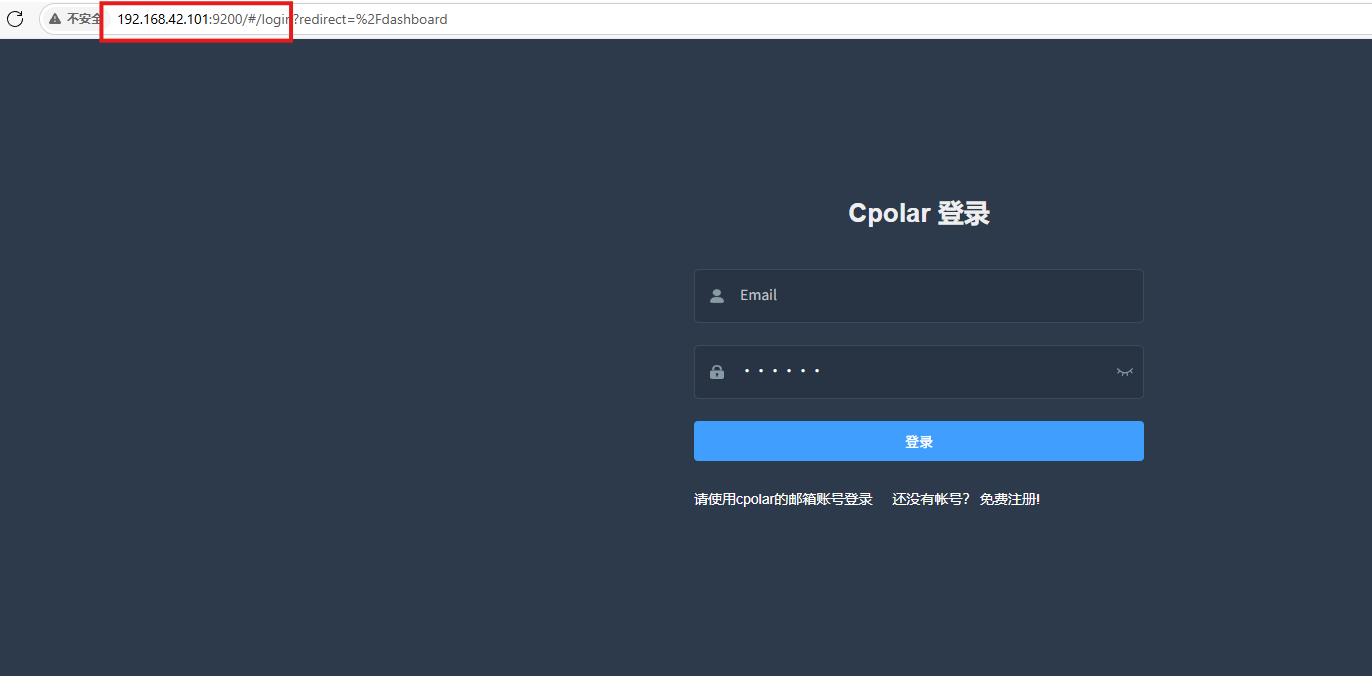
服务正常后,通过:
http://192.168.42.101:9200
进入管理页面。
当前超链接目标写的是:
http://localhost:9200/
19. 这次公网测试映射的是 8001
当前跨网络示例明确写的是:
使用 8001 端口测试。
也就是说,这一段映射的是最前面的 my_app.py Exporter,而不是前面的 8002 动态任务 Exporter,也不是 8003 文件队列 Exporter。
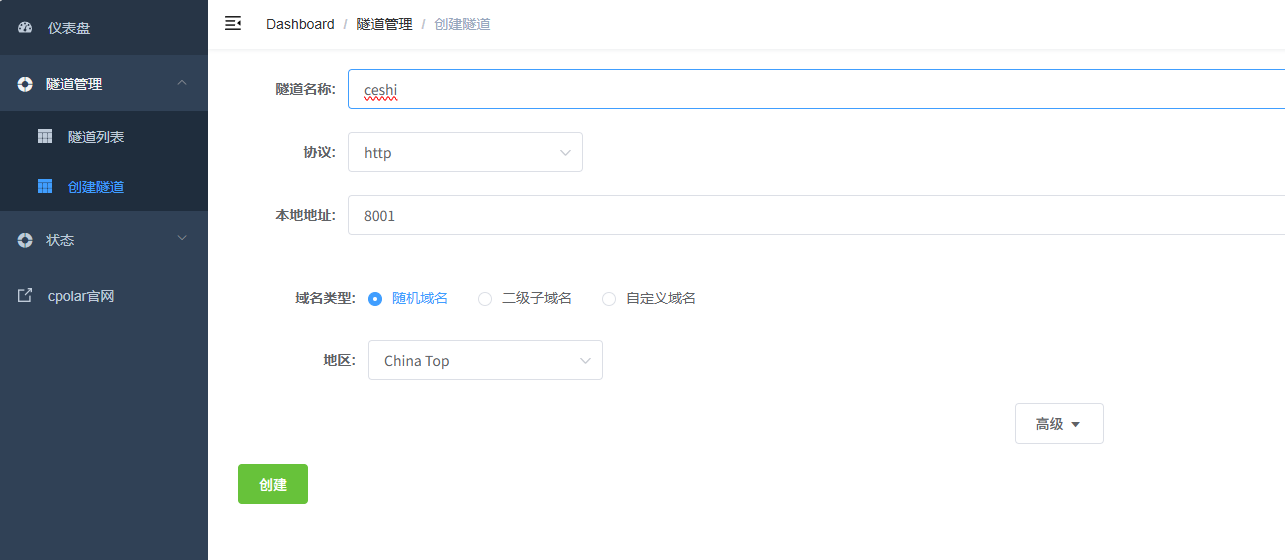
创建隧道参数:
- 隧道名称:
ceshi - 协议:
http - 本地地址:
8001 - 域名类型:随机域名
- 地区:
China Top
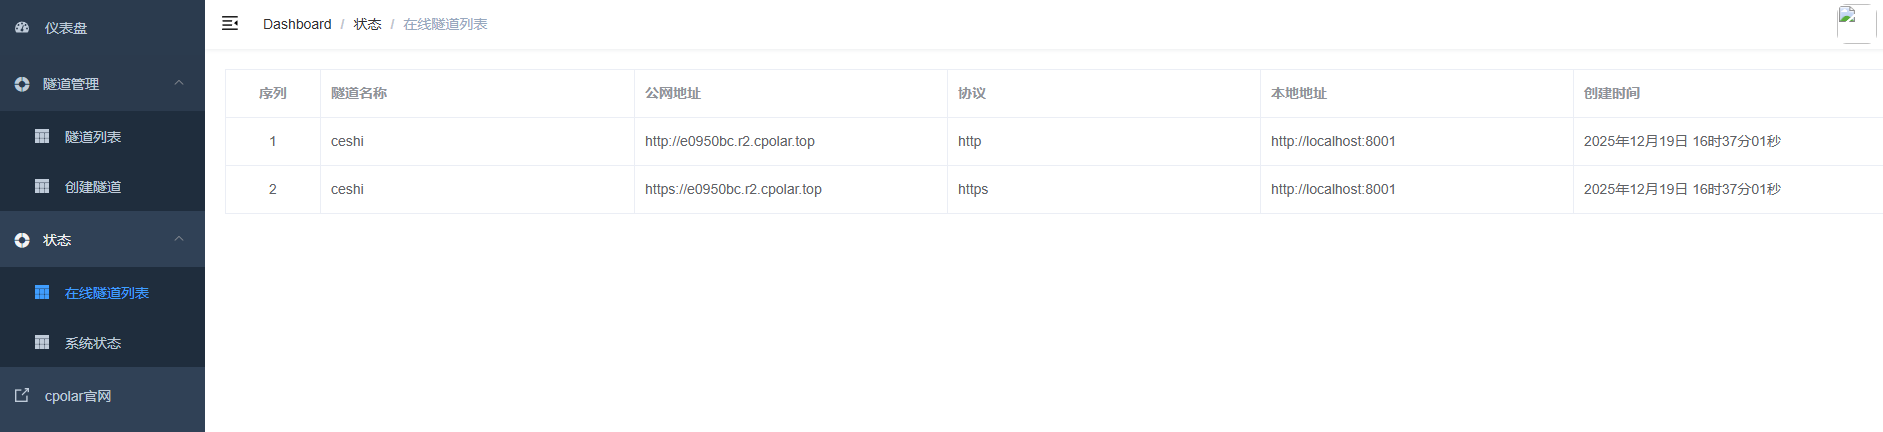
创建后查看公网地址。
20. Prometheus 直接抓公网 Exporter
这时 Prometheus 配置里不再写 localhost:8001,而是写公网目标:
  - job_name: 'my-app'
    static_configs:
      - targets: ['e0950bc.r2.cpolar.top']

当前目标是:
e0950bc.r2.cpolar.top
保存配置以后,监控成功。

这一层形成的是:
内网 Exporter 8001 → cpolar HTTP 公网地址 → 另一侧 Prometheus 抓取。
这里真正解决的是网络可达性。
Exporter 仍然负责 /metrics,Prometheus 仍然负责抓取和规则计算。
21. 随机地址跑通后,再换固定二级子域名
随机地址适合验证连通性。
如果 Prometheus 配置长期依赖这个 target,地址不断变化就会带来额外维护。
进入 cpolar 预留页面。
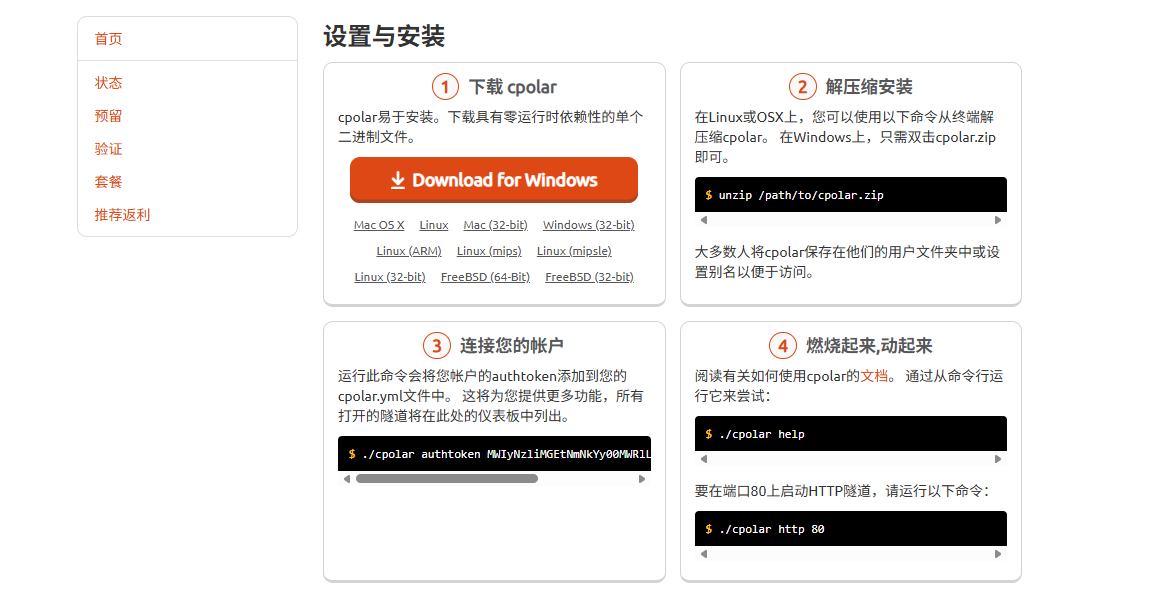
选择保留二级子域名:
- 地区:
china top - 二级子域名:
ceshii

回到隧道列表后继续编辑。
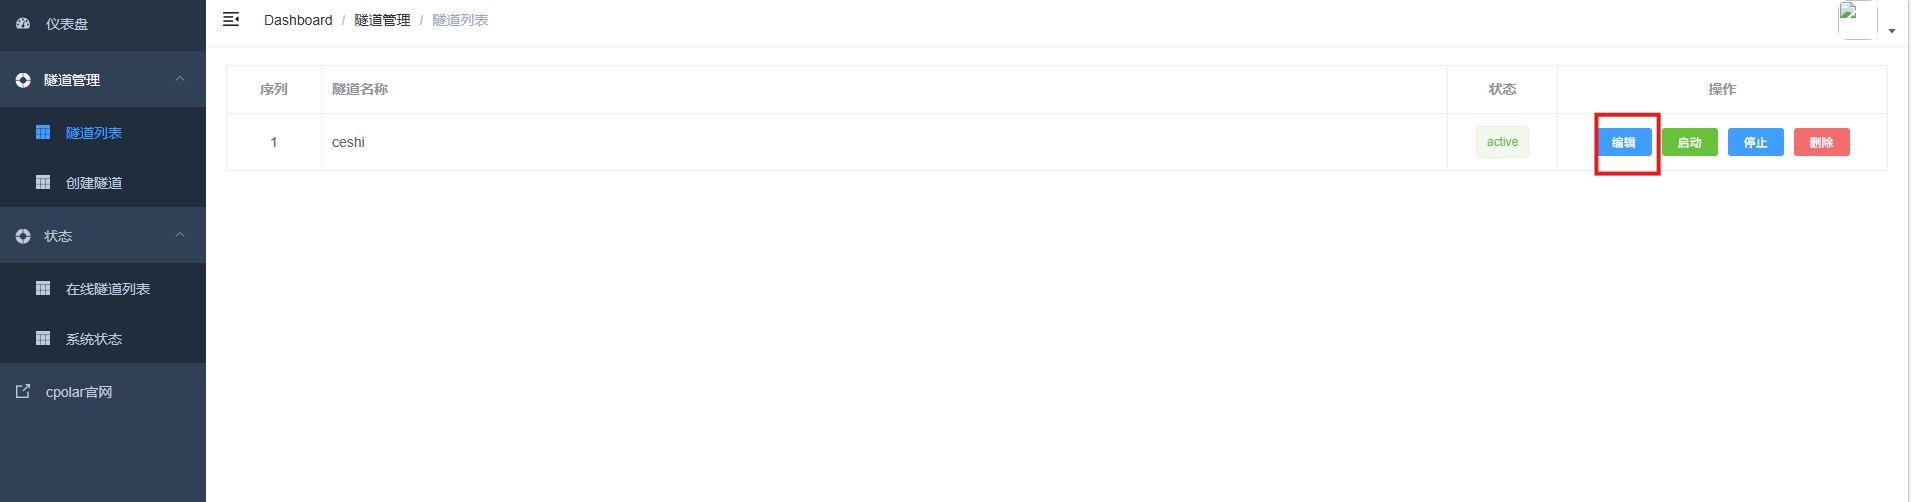
这里还有一个命名差异:
前面创建的隧道名是:
ceshi
但固定域名阶段文字又写成:
prometheus
实际操作时先确认自己正在编辑的是哪一条真正指向 8001 的隧道,不要只按名称机械寻找。
修改:
- 域名类型:二级子域名;
Sub Domain:填写保留成功的名称;- 地区:
China Top。
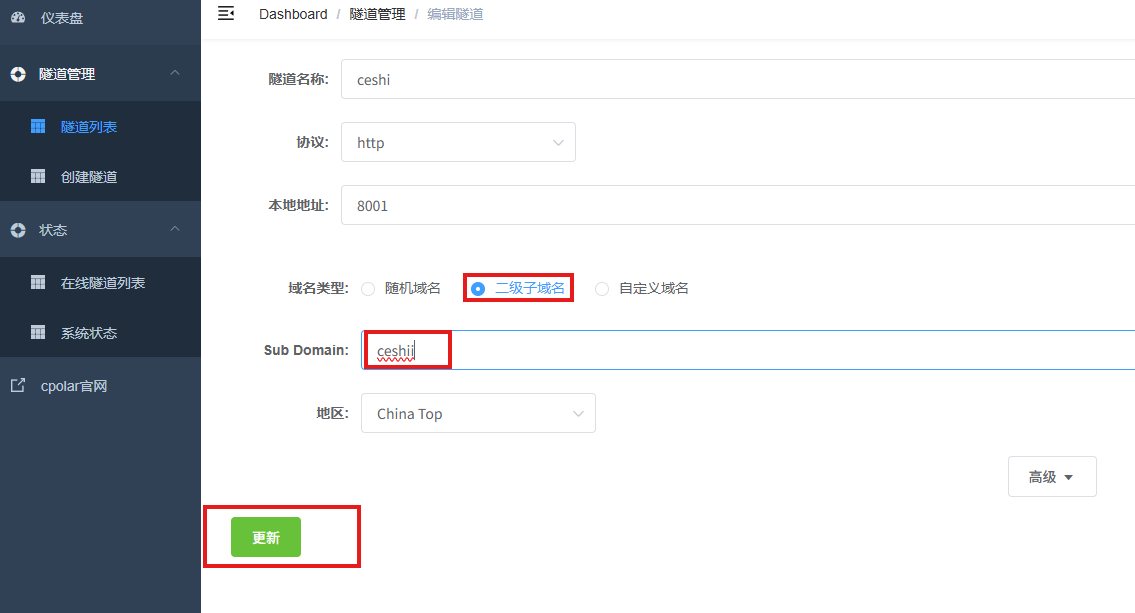
更新以后查看在线隧道。
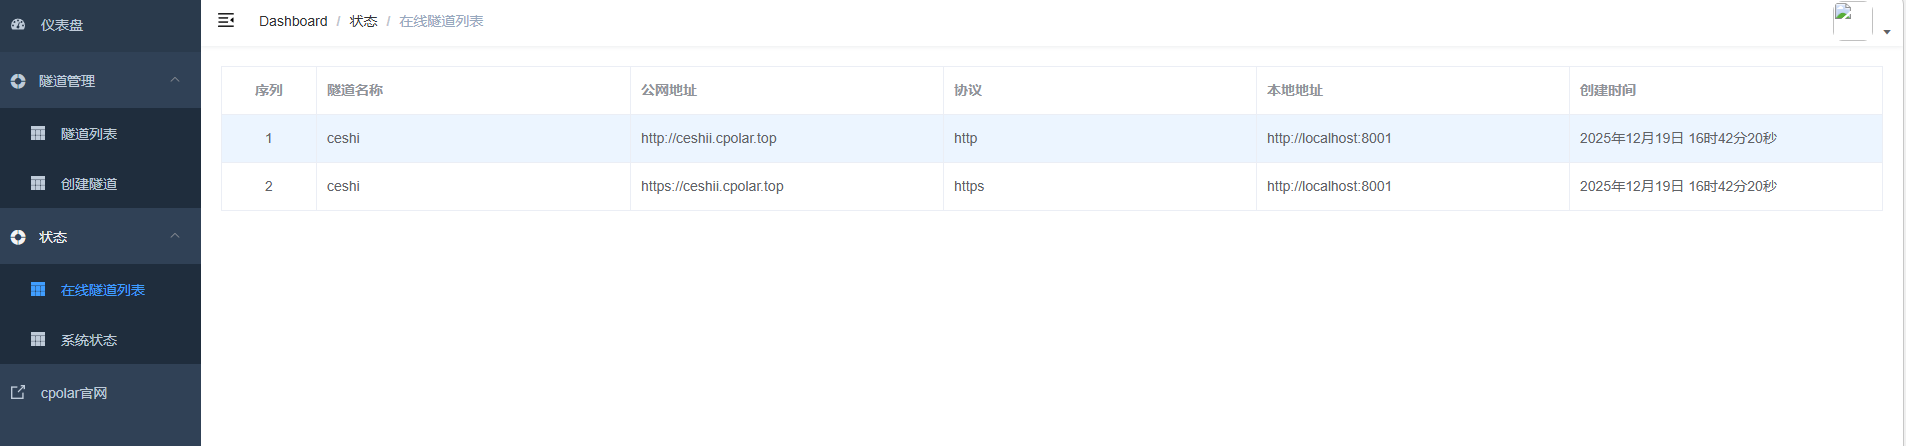
最后访问固定公网地址。
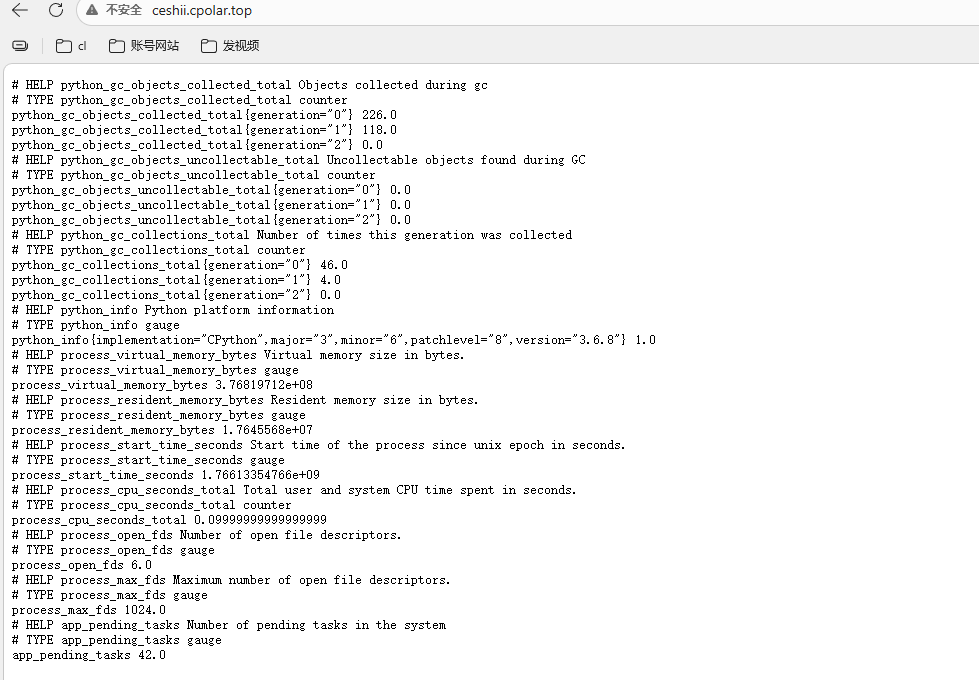
到这里,Exporter 的公网入口就从随机地址切换成固定二级子域名。
22. 三个例子其实是在教同一件事
把整篇压缩以后,三个实验只有一个核心:
先找到业务状态,再把它暴露成指标。
第一层:
42 → app_pending_tasks → 8001
只验证指标格式。
第二层:
/tmp/pending_tasks.txt → app_pending_tasks → 8002
开始监控动态值,并加 >50 / 2m 规则。
第三层:
目录文件数量 → file_queue_pending_count{directory=...} → 8003
开始使用标签,并加 >100 / 5m 规则。
最后:
8001 → cpolar → 公网域名 → 远端 Prometheus
解决跨网络抓取。
这套思路以后换成数据库积压、业务状态、脚本结果或者 API 计数,本质上还是同一个模型:
读取 → 转换成指标 → 暴露 → 抓取 → 查询 → 规则。
总结
这次真正跑通的主线是:
Python prometheus_client → Gauge → /metrics → 8001 固定指标 → Prometheus 抓取 → 8002 动态任务数 → app_pending_tasks > 50 持续 2m → 8003 文件队列 → directory 标签 → file_queue_pending_count > 100 持续 5m → 150 个测试文件 → cpolar → 8001 公网暴露 → Prometheus 公网 target → 固定二级子域名 ceshii。
几个细节值得继续留意:
my_app.py使用8001,task_exporter.py使用8002,file_queue_exporter.py使用8003,三套端口不要混用;- 动态任务测试中的 curl 命令写的是
localhost:9100,与脚本的8002不一致,遇到无数据时先核对监听端口; mkdir -p /data/incoming /logs/upload_queue python3 file_queue_exporter.py &把建目录和启动脚本写在同一行但没有连接符,执行后要确认 Exporter 是否真正运行;- 当前内容展示了 Prometheus 告警规则和告警状态,没有完整配置 Alertmanager 路由或通知渠道,所以不能把“规则触发”直接写成“通知已经送达”;
- cpolar 部分实际映射的是
8001入门 Exporter,不是8002或8003; - 隧道前面命名为
ceshi,固定域名阶段又出现prometheus,配置时要确认实际隧道; - cpolar 只解决 Prometheus 到 Exporter 的网络访问,不产生指标,也不负责告警判断。
对我来说,自定义指标真正有价值的地方,是把“系统看起来没事,但业务其实已经堵住了”这种模糊感觉变成一个能查询、能留历史、能设阈值的数字。Prometheus 不需要理解你的业务,只要你先把业务状态翻译成它认识的指标。
转载自 CSDN-专业IT技术社区
原文链接:https://blog.csdn.net/2301_80840905/article/details/166644530